A past-time of my neighbor and I is to collect our game camera cards, pull out a favorite libation, and watch the videos that ensue. We do it on a bi-weekly basis.
The purpose of setting up a game camera is to get videos of deer. And, of course, videos of bucks with large antlers are the most exciting. But we get entertained by other critters as well – like doe fighting, coyotes and bobcats strolling through, not to mention possums, foxes, and more.
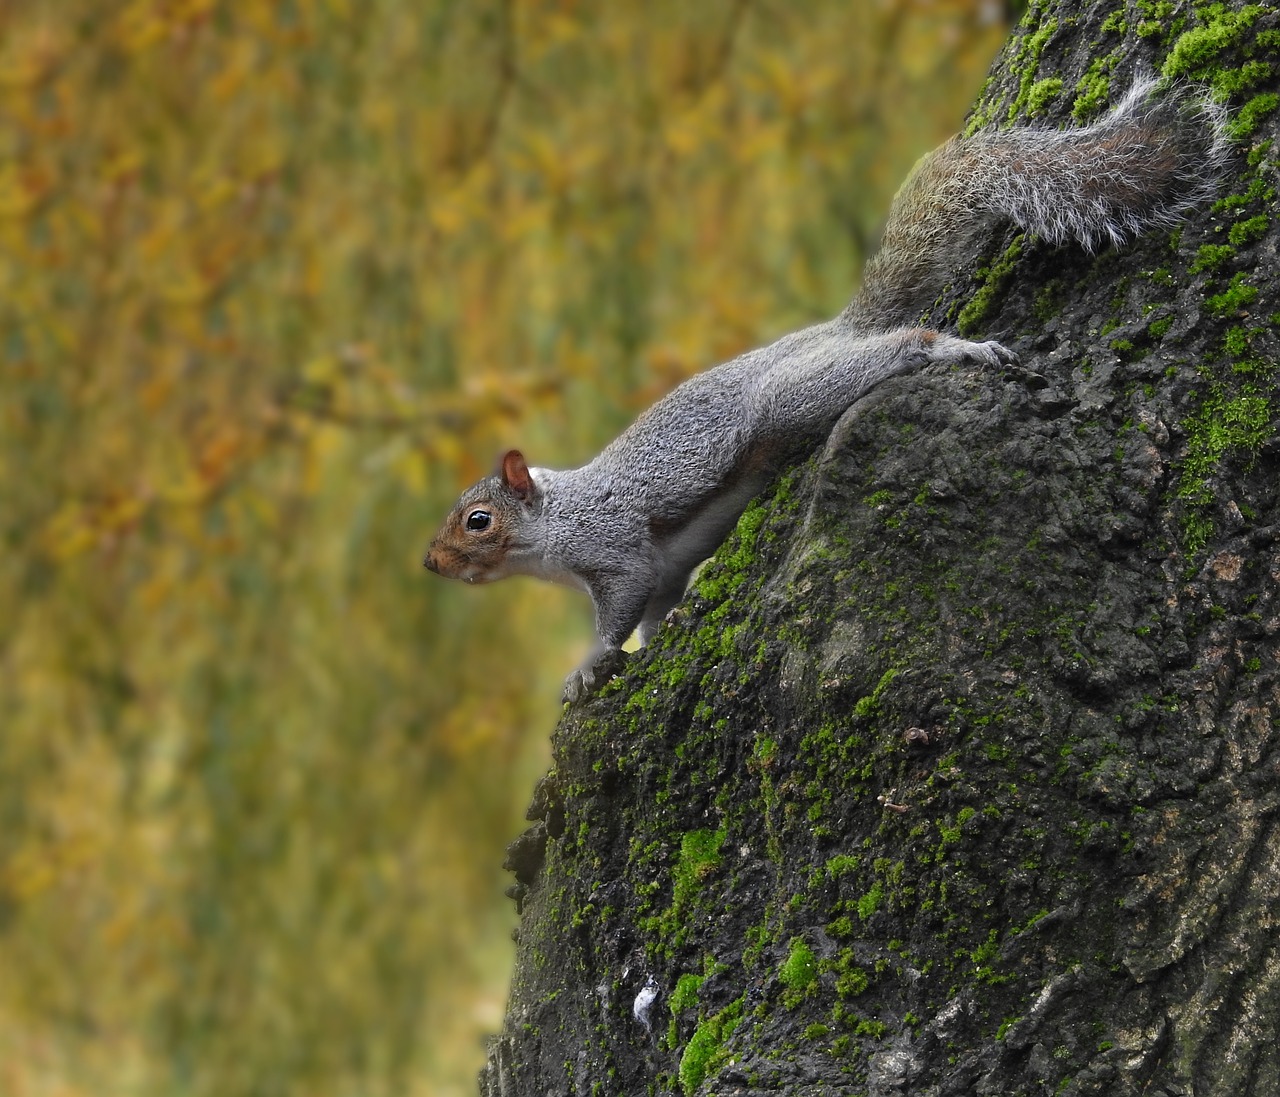
This past fall was a pretty good year for acorns. At some of our cameras in December, we watched more squirrels than deer. There seemed to be more squirrels than even leaves falling! Among all these squirrels one stood out due to its very distinctive bobbed tail!
Poor sucker! Tails are important to squirrels. They provide the assist that allows them to be the acrobats of the forest that they are. As squirrels leap from one tree to another, their tail is what keeps them from making a mistake.
Sometimes they fall. But that tail is like the pole used by entertainers in a high-wire act. It provides balance when the unexpected happens.
I don’t know if this poor squirrel was more likely to fall out of a tree, but we could certainly identify him whenever he showed up in a video! I wonder how he lost his tail…
But how do you use squirrels to count deer? Yeah, we’ll get there but it might be painful.
A clever statistician, Dr. David Bowden, had the insight to realize that if you observed a uniquely identifiable animal X times when you conducted surveys, and also recorded the number of observations of unidentified animals, you could estimate the total number of animals in the population!
How, you might ask. Well, let’s say that, on average, you see 5 marked, uniquely identifiable animals 50 times over the course of your surveys. That means, on average, you see each marked animal 10 times. And during your surveys you also see 100 unmarked animals, for a total of 150 sightings (100 unmarked + 50 marked). If you’re willing to assume that you are just as likely, on average, to see a marked animal as an unmarked animal then…
Population size = 150/(50/5) = 150/10 = 15 animals
So, back to our squirrels. Between December 17, 2023, and January 10, 2024, we had 81 videos of squirrels. In those 81 videos we observed our “bobbed tail” squirrel 4 times. We also observed 98 squirrels with full, fluffy tails. That means we had 102 squirrel sightings.
So if we saw a squirrel, on average, 4 times (the number of times we saw the bobbed-tail squirrel) then 102 sightings means there are 102/4 = 25.5 squirrels in our woodlot. How cool is that? The most number of squirrels we ever saw in a single video was 3!
Can you translate that into a density? No, because we don’t know the area all those squirrels cover. Is it a useful number? Ummm…. probably not.
How is this even relevant to deer?
Well, let’s say you have three bucks with identifiable racks. One buck might have a right beam that goes way out to the side. Another has a funky brow tine. A third has a broken G2. Consider each of those bucks marked such that you can calculate the average number of times you see them ([5 + 10 + 6]/3 = 7 sightings/deer). Tally up the total number of buck sightings (including those you can uniquely identify) and divide by 7. That’s your population estimate.
Is it a reliable estimate? Hard to say (without a lot more math). Can you translate that to a density? No. Is it fun? For me, yes!
You could even apply this method to females if they have uniquely identifiable marks. We had a doe last fall with a crippled front leg. Other doe might have other injuries or markings (e.g., pie-bald deer) that can be used to uniquely identify them.
Don’t get too serious with this method. I am sparing you the discussion about all nuances of the estimator that can trip you up, but I have written about them! If you are super-serious about your game camera photos – and I know some of you are! – this is a fun way to try to objectify your idea of how many deer are out there.
Please think of this as entertainment. You’re unlikely to get an estimate that is useful for making management decisions. But if you love tracking your deer pictures, and you like math, it can keep you occupied and out of trouble!
-Duane Diefenbach