Yes, Bill. We are all mortal. It’s the cold hard truth of our existence and, in fact, the existence of every creature on earth. Mortality is often the focus of research regardless of species. Type in “mortality wildlife” into Google Scholar and in 0.09 seconds over 1 million articles appear.
So after almost 2 decades, what do we know about deer mortality?
A recent post summarized how, who, where, and when we captured over 5,000 deer. Captures can be considered a birth of sorts – the beginning of a research life. Now we fast-forward to the end of that life. To summarize it means condensing 5 theses into less than 1,000 words. (Who says we don’t have talent!)
Our research on deer began in 2000 with a study of fawn survival. But we are going to save the spotted cuteness for another post. Mostly, because we have come full circle on this topic.
Moving on to big deer. Of course, the first big deer survival study focused on bucks. Antler point restrictions (APRs) were about to change how bucks were harvested and we needed to know the specifics of that how. So from 2002-2005 we studied survival and harvest rates of bucks.
Prior to APRs the harvest rates on antlered deer was about 80% annually. What does that mean? It means that 80% of the antlered deer population was harvested every year. You can read that again to let it sink in. Very, very few bucks survived past 3.5 years old.
In 2005-2006, females got their turn on the research treadmill. We focused on female harvest and survival rates on both public and private lands around the Sproul State Forest and Tuscarora State Forest. After that (from 2009 and onward), both male and female survival and harvest rates have been studied in Wildlife Management Units 4B (southcentral PA), 4D (central PA), 3C (northeastern PA), 2D (western PA), and 2G (northcentral PA).
Our current research is in WMU 2G (Susquehannock State Forest) and WMU 4D (Rothrock and Bald Eagle state forests). As it is still ongoing (and we need material for this blog), results from this study aren’t included in today’s blog post.
Ok, so now you have the stage, the actors, and the storyline. How do these acts play out?
Here is a histogram of all the harvest rates we have estimated from different studies over the years.
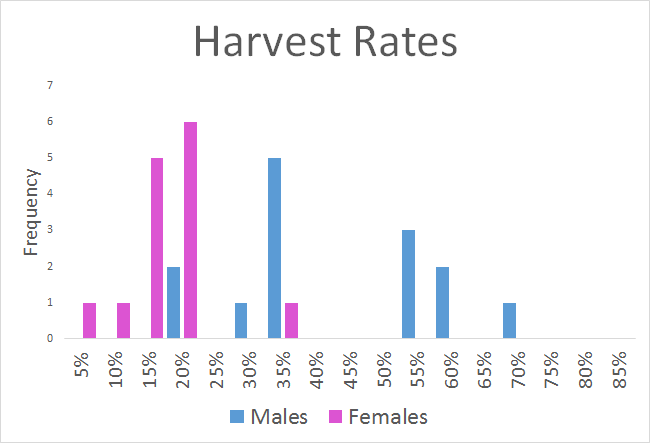
Here are some points to alleviate confusion:
- Males (blue) generally have higher harvest rates than females (pink). That’s expected because antlerless licenses are limited.
- The lowest harvest rate for females (4.4%) was recorded on public land in WMU 2G. It was almost 4 times higher (16.7%) on private land.
- The higher harvest rates of males were for adults (29-69%) whereas subadults (yearlings) had harvest rates that ranged 16-35%.
- The lowest harvest rate for subadult males occurred in WMU 2G (16.0%)
- The lowest harvest rate for adult males also occurred in WMU 2G (29.0%)
- The highest harvest rate overall was for adult males in WMU 2D (68.5%)
In all of our studies of deer >1 year old for both males and females, the primary cause of death was hunting. Outside the hunting season the primary cause of death was always vehicles. So for deer, the vehicle that transports them from nature to eternity is a bullet or a bumper.
Because hunting is the primary cause of mortality, survival rates are essentially the opposite of harvest rates.
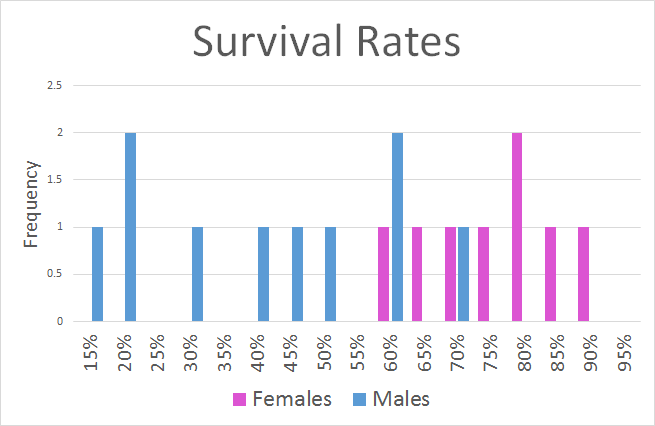
Confusion reducer:
- The highest female survival rates occurred in WMU 2G (76-90%)
- The lowest female survival rates occurred in WMU 2D (60%)
- The highest male survival rate was in WMU 3C (subadult males: 67%)
- The lowest male survival rates (all adults) were in WMUs 4B, 3C, and 2D (11-17%)
Pink and blue columns spread out over 100% – pretty but what does it all mean?!?! And why estimate harvest and survival rates at all?
Management! Andrew Norton used this information in his thesis to develop an improved population estimator for Pennsylvania. Franny Buderman used these data to develop a population model to better understand the effect of eliminating the first week of concurrent antlered and antlerless hunting during rifle season. This research supports informed management recommendations by PGC staff to the Board of Commissioners.
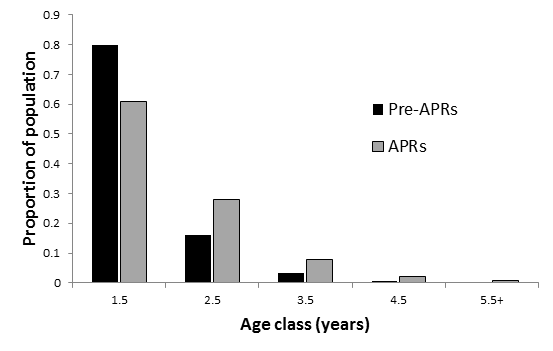
Another application of these data is in making projections of the population age structure. Remember those pre-APR harvest rates of 80%. Well, today they are <50% for subadult males and 50-70% range for adult males.
Take a look at what the change in harvest rate does to proportion of older-aged males in the population.
Harvest and survival rates for the ladies also explain how 6- 7-, and 8-year-old does show up regularly. However, 13-year-old does are still pretty rare.
To be or not to be, that is the question.
Whether ‘tis nobler for deer
to die by the bullet or the bumper
is not our worry. For in that sleep of death,
we construct models and build histograms
to understand Calamity’s consequence.
Ok, we aren’t quite as eloquent as Shakespeare, but we do know a little about death. At least when it comes to deer.
-Duane Diefenbach and Jeannine Fleegle
If you would like to receive email alerts of new blog posts, subscribe here.
And Follow us on Twitter @WTDresearch