Using game cameras to do science is pretty awesome. You put out a camera on a tree or a post, turn the camera on, and then sit back and wait for the sweet, sweet data to come rolling in. Of course, you don’t want to wait right at the camera. It’s best to give them a little space while they do their thing.
But game cameras have one huge drawback. You could be having a bear party right behind the camera, tons of bears with blueberries and beer and a band, the works, but if they don’t end up in front of the camera, you will never know about that bear bash.
Luckily, scientists have come up with a way to figure out the likelihood that we will actually see a bear (or bobcat or coyote) on camera if it’s in the area. This likelihood is called the “detection probability”. And because our methods aren’t perfect, we always assume that we miss some animals (or that detection probability is less then 1).
Here’s some raw data fresh from the camera to illustrate this phenomenon (from Rothrock and Bald Eagle state forests).
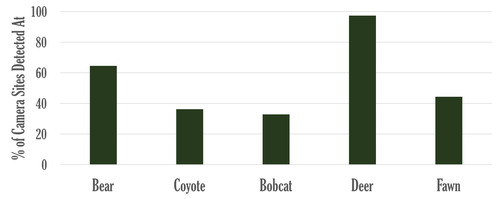
With the raw data, bears were seen at 64% of the camera sites and deer were basically seen at every site. Coyotes and bobcats were a little harder to get pictures of with detections at 36% and 33% of the camera sites, respectively. As for fawns? They were close to the middle with 44% of the camera sites yielding at least one fawn picture.
But what about those sneaky bobcats and those bear parties that happen just out of the game camera’s sight? This is where the detection probability comes into play. I put these data into one of my occupancy models and ended up with this graph.
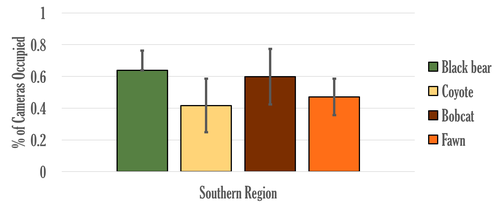
Looks a little different, doesn’t it? Different colors, error bars which tell us how precise the estimate is, and some of the bars seem to have gotten taller. How does this work, you ask?
Black bears and fawns stayed around their original estimate (64% and 48%) suggesting that if there were any black bears or fawns out and about, we’d get a picture of them. However, coyotes and bobcats changed drastically. Coyotes jumped up to 42% suggesting that at 8% of the camera sites, coyotes were there but were camera shy. And bobcats, those guys are slick! Bobcats went from 33% of the camera sites to 60%, a 27-point jump!
These models help us understand what the cameras don’t see.
Let’s wrap up with these cool maps. These are the camera sites that we surveyed in Rothrock in 2016 and 2017. If you look closely, you can see that there are some differences in where species were detected.
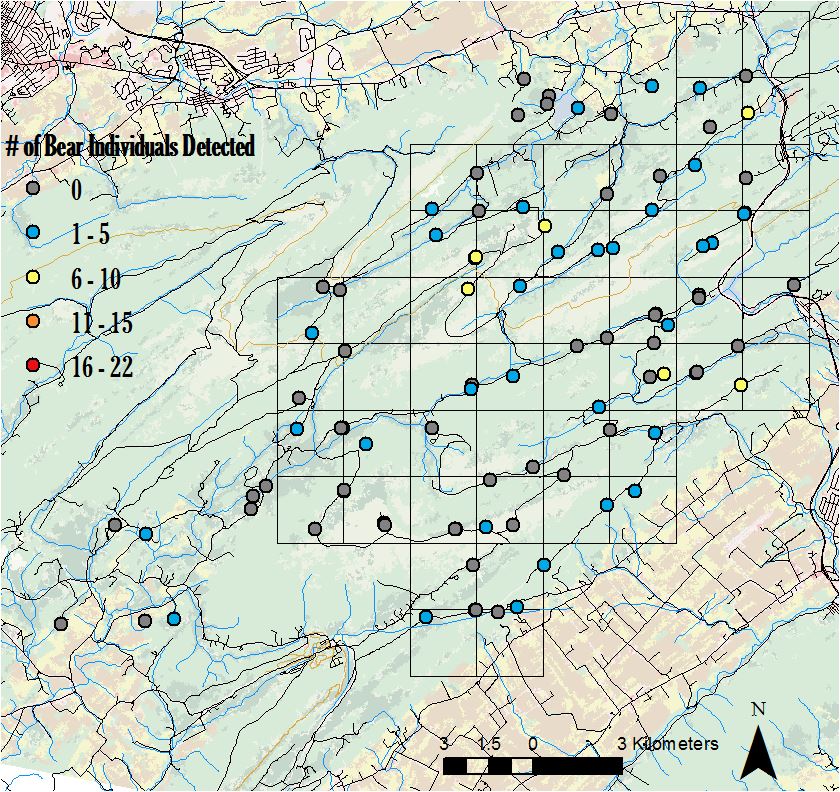
Bears were largely seen within the state forest (where the grid cells are), although some were detected on private land.
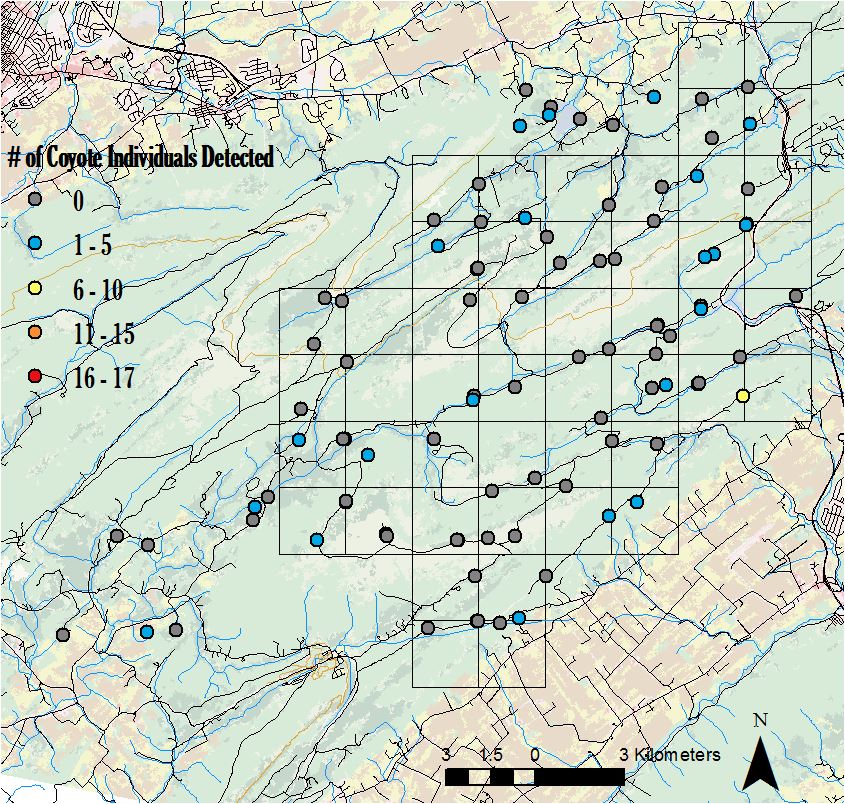
We didn’t see coyotes at a lot of the sites in Rothrock, but when we did, they tended to be on the edges of the forest/grid cells.
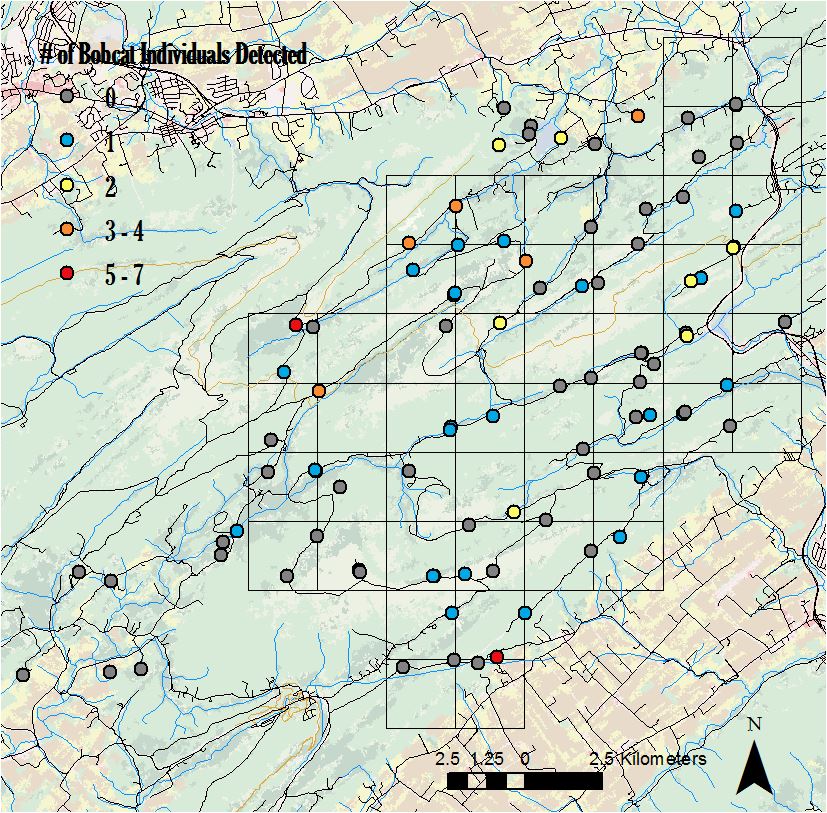
Bobcats were kind of all over the place, but largely within the state forest with some hotspots in the north.
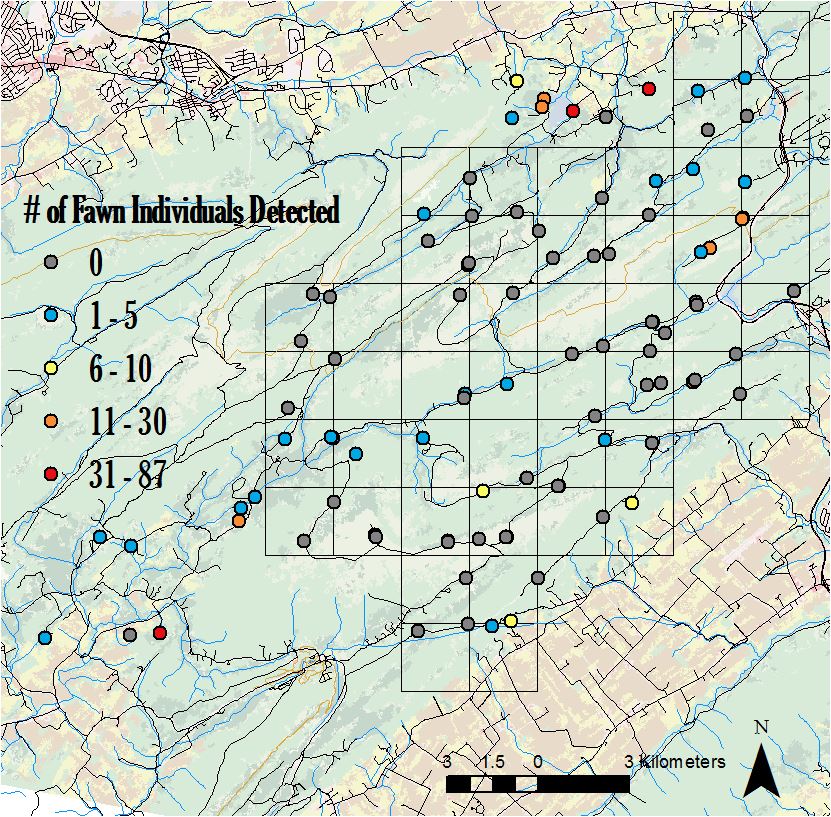
And as for fawns, they seem to have almost the opposite pattern compared to all the carnivores. A few sites in Rothrock, but sticking mostly to the edges with a lot of detections on private land.
So the parties are happening in different locales for each. Invitations must be hard to get.
Ph.D. graduate student
If you would like to receive email alerts of new blog posts, subscribe here.
And Follow us on Twitter @WTDresearch