About a year ago, someone asked me about the October Lull. I didn’t know what he was talking about. I had never heard of it. For someone who has studied deer movements for a very long time, you would think I would know about this consistent and predictable drop in deer activity.
So I asked my colleague who has studied white-tailed deer, elk, and mule deer. He hadn’t heard of the October Lull either.
That made me feel a little better.
Then last week a reader (we’ll call him Joe) emailed me about whether we had any data on buck movements that might shed light on the “dreaded October Lull.” I was skeptical it even existed.
I replied to Joe that if he could give me more specifics about how I could use our location data to assess whether there is any truth to an October Lull, I would find time to look at our data.
Joe thought I could detect 2 changes in movement:
-a reduction in home range size; and
-less movement during the day with possibly more movement at night
Since it takes a lot more work to calculate home ranges, I first analyzed deer movements. I calculated on a weekly basis the average speed of male deer (meters per hour) for each hour of the day. All our male deer are at least 2.5 years old, and many are older. We don’t have a huge sample size for last fall – about 5 bucks.
If you’re an avid reader, you have seen these types of graphs before. Jessica Hepner created them when she looked at whether moonlight affected deer movements.
In the graph below, the orange lines show the average hourly speed of bucks for the first 3 weeks of October 2017 (October 2 – 22). We know that about 20% of females are bred in the last week of October so I figured the October Lull had to be over by the 23rd.
The black lines are the two weeks prior to October 2nd (i.e. the last 2 weeks of September).
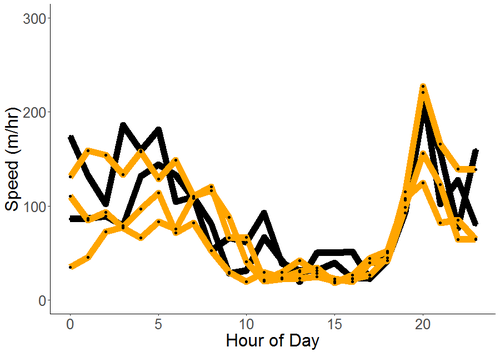
If there is any difference, I don’t see it. There certainly isn’t more movement at night and the daytime movements are not any lower. What I haven’t shown in this graph is the variability about each point – it is quite large and none of these differences among weeks are statistically significant.
Take a look at deer movements once the rut kicks in (green lines)! These green lines represent movements until the middle of November (the rut is half over by this date).
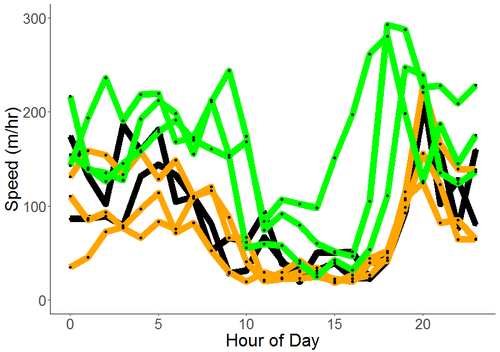
We know there is a flurry of hunting on the opening Saturday of archery season – typically, the Saturday closest to October 1st. After the excitement and anticipation of opening day, deer harvests in the following weeks drop until the rut kicks in.
If there is an October Lull, maybe the deer see a lull in hunters, not the other way around! We’ll have to see what home ranges look like over these same time periods.
-Duane Diefenbach
Read follow-up posts on this topic
If you would like to receive email alerts of new blog posts, subscribe here.
And Follow us on Twitter @WTDresearch