Those of you in a certain demographic may remember the SAT. A standardized test used to evaluate your college readiness covering various verbal and mathematical skills including a vocabulary section. “Latent” is a classical SAT prep word. “Latent” is defined as “(of a quality or state) existing but not yet developed or manifest; hidden or concealed.”
It sounds highbrow but, we deal with latent states all the time. Where is my kid and why isn’t he home already? How long will my commute be? Sometimes I feel like my checking account has a latent state – exactly how much money is in there?!
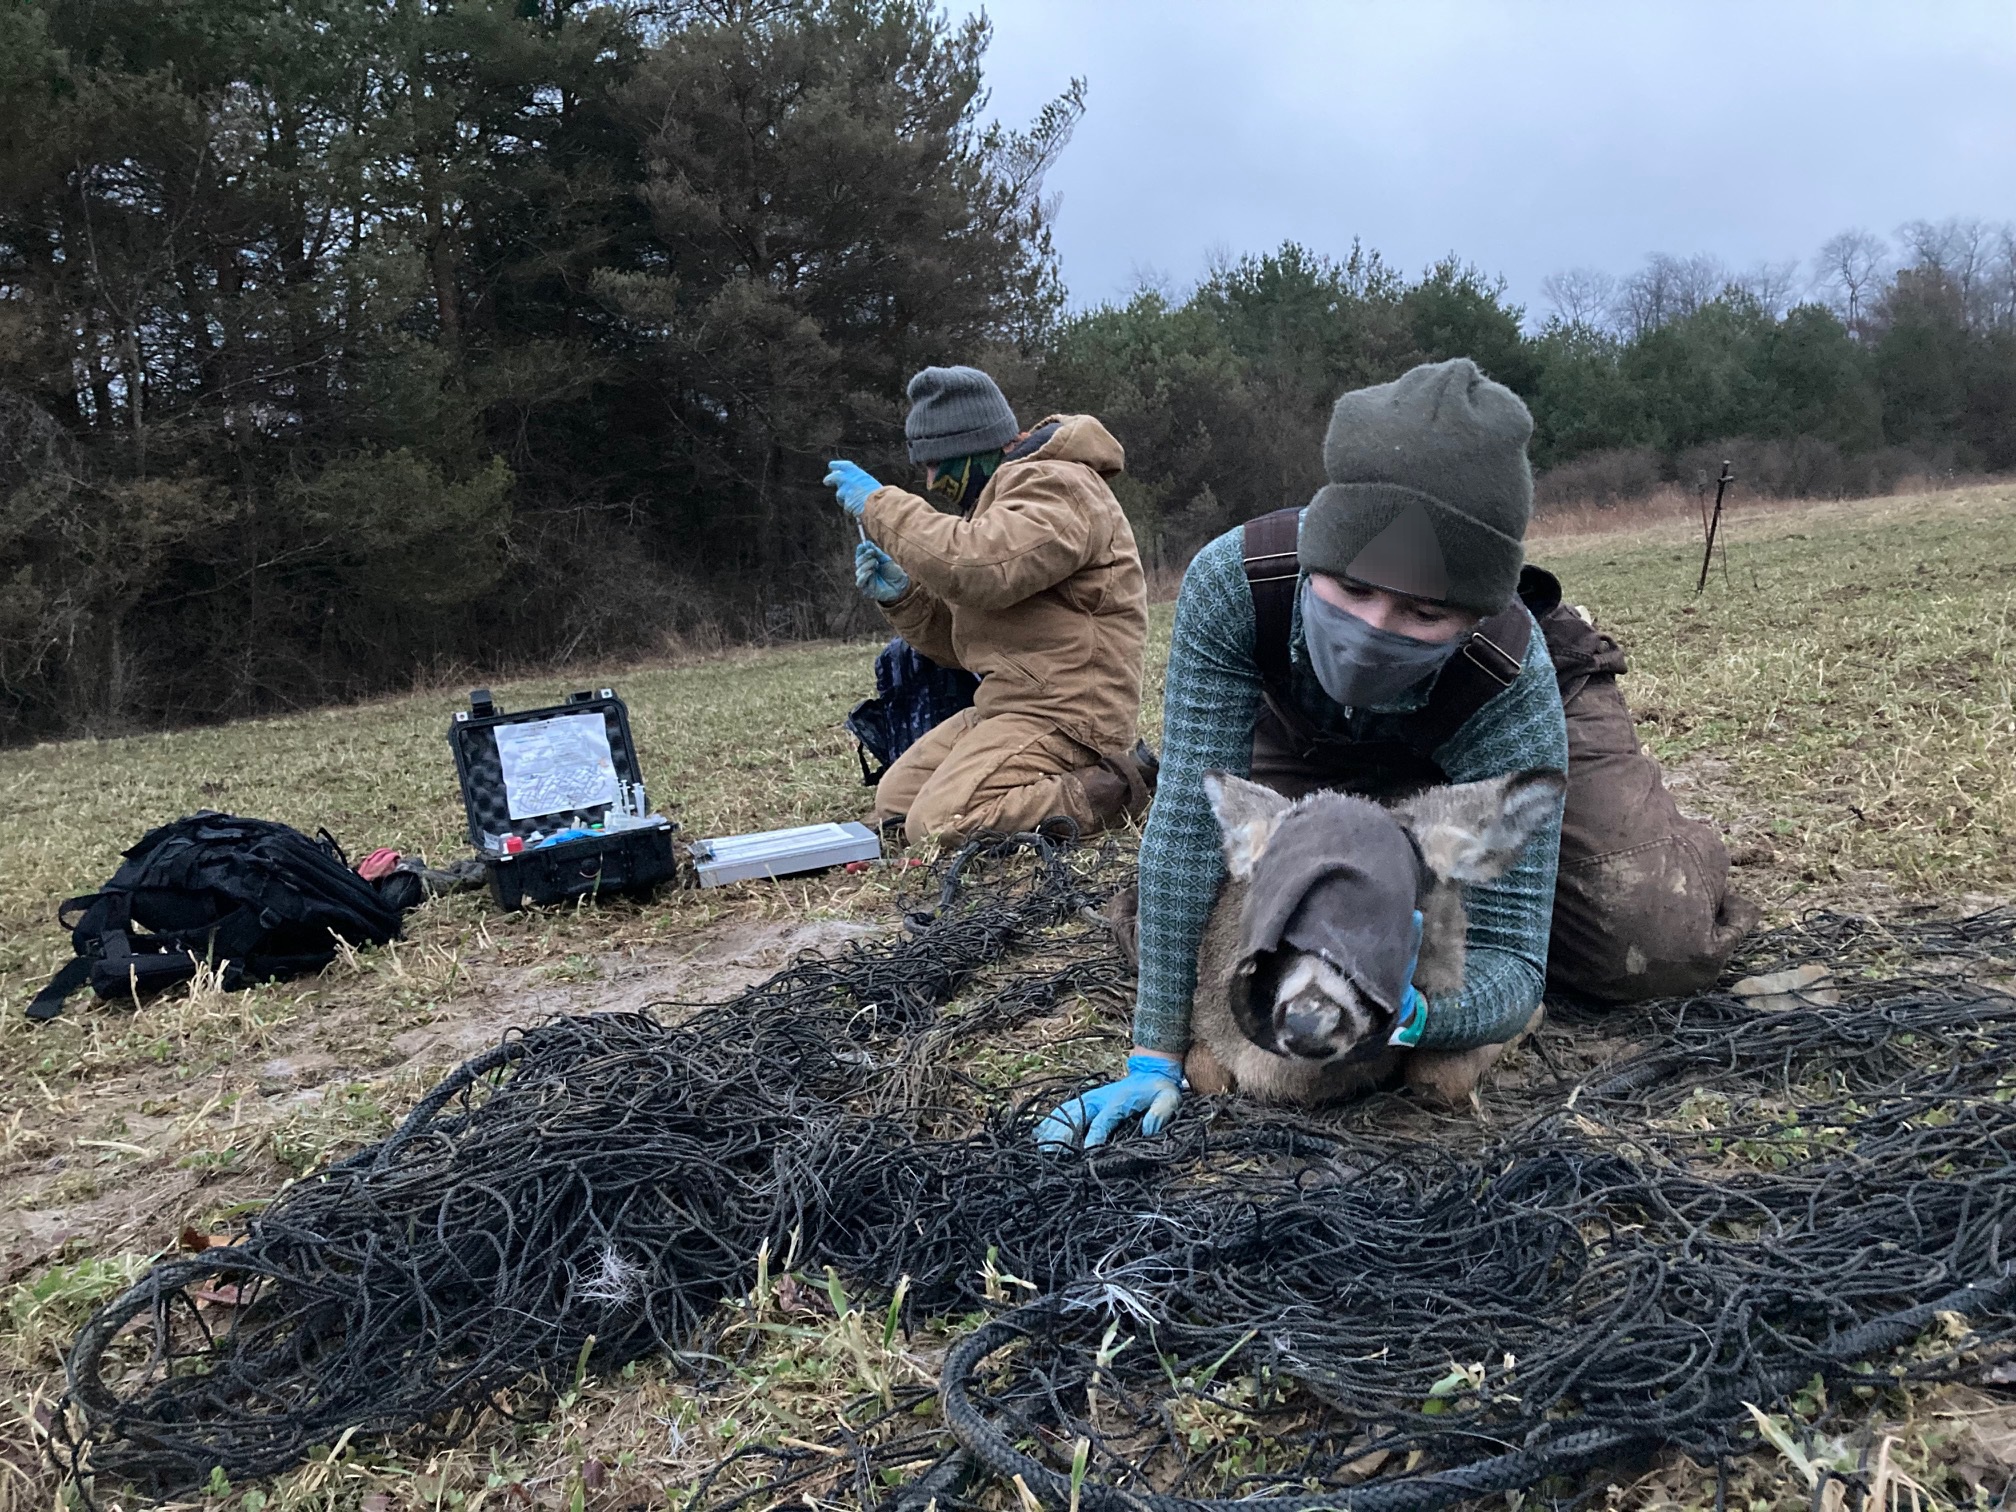
Latent states might be considered the foundation of wildlife research and management. We want to know the latent state of an animal (alive or dead), or group of animals (e.g., percent that survive), or population (e.g., number of deer).
We capture animals and sometimes recapture them – but what about the ones we never see again? We count animals but we don’t see all of them. We will never score 800 on the SAT no matter how good our vocabulary is.
Hunting is no exception either. Is that 10-point buck you saw on the game camera alive, dead, or anywhere near your hunting stand!?!
Science is the search for truth. We gather information in search of that truth. And while we rarely have a complete picture, what we do observe may provide some insights into what is going on in that “latent” state. For example, 20 years ago Pennsylvania implemented antler point restrictions (APRs). During the trapping season before they were implemented, we captured 15 button bucks and 14 adult does for every adult buck captured.
Adult bucks were VERY difficult to capture!
One year after APRs (2003), we capture 9 button bucks and 10 adult does for every adult buck.
By 2004, we captured 2 button bucks and 2 adult does for every adult buck.
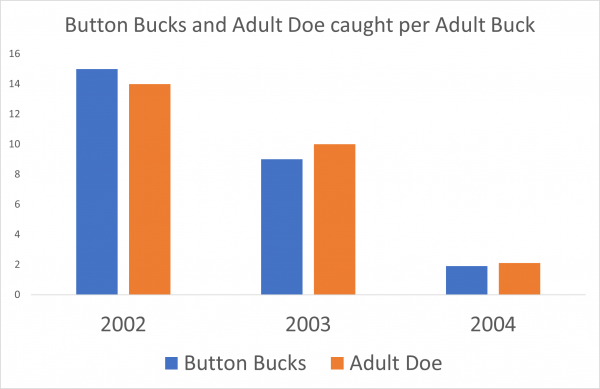
But what do those observations mean? Not much on the face of it, but it suggests there were a lot more adult bucks by 2004 compared to 2002.
Wildlife researchers and managers have developed techniques to account for imperfect observations to inform those latent states we are studying. In this case, the number of adult bucks in the population. Using those methods, we showed adult buck abundance increased in Pennsylvania (Wallingford et al. 2014).
For comparison, let’s look at our capture data from the Deer-Forest Study. For males, the ratio has flipped. Compared to 2002–2005, when we were capturing multiple button bucks for every adult buck, we capture MORE adult bucks than button bucks. The 10-year average is 0.67 button bucks for every buck.
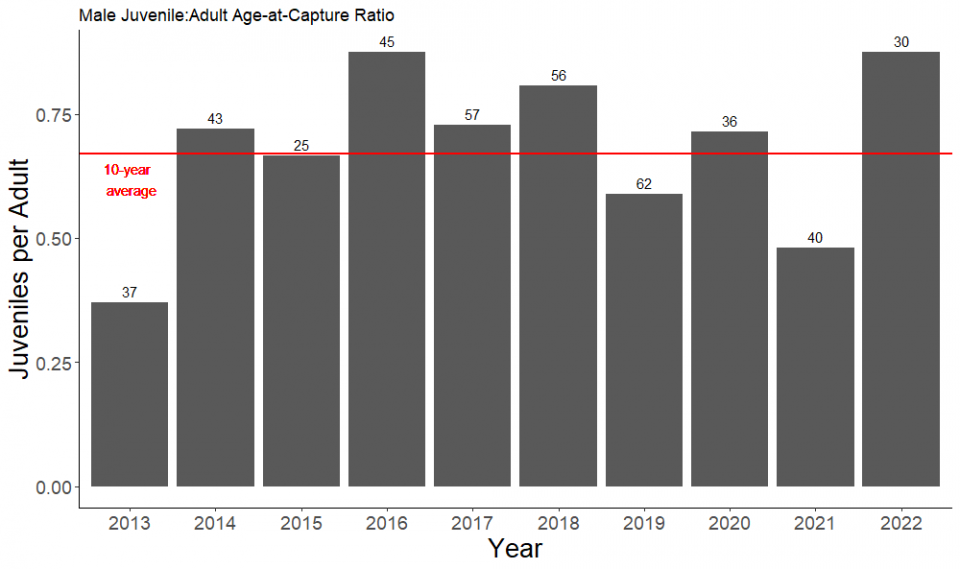
Similarly, the ratio of adult female captures to adult male captures is nearly equal. We now capture 1.2 adult females for every adult buck. Does that mean the sex ratio of adult deer is nearly 1.0? Not necessarily.
However, these observations make sense in light of our findings that harvest rates, especially on adult males, in the Deer-Forest Study are some of the lowest we have recorded in Pennsylvania. But it probably won’t affect our SAT scores.
-Duane Diefenbach