If you took the time to plant and tend a garden this summer, all your hard work pays off in August. Tomatoes, cucumbers, peppers, melons, and the dreaded zucchini abound. But veggies aren’t the only thing ripe and ready.
I was recently interviewed on a podcast and asked about August and September home ranges of bucks. Like your garden, their antlers are “ripe” by the end of July and harden by mid-August. The podcast hosts were wondering if any changes in behavior might begin.
I haven’t noticed changes in home range size until late October. But the question got me thinking. If gardens and antlers are transforming, maybe a deeper dive in the data might reveal some hidden gem?
So here goes.
Rather than spend hours analyzing location data in complicated home range programs, I decided to try and keep it simple. A standard deviation (SD) is a measure of variability in a group of numbers – it’s basically the average distance of all points from the mean. So if the center of a home range is the “mean,” we can calculate a SD of locations in the east-west (longitude) and north-south (latitude) directions.
If you double the SD, then plus or minus 2 x SD encompasses about 95% of all locations. It’s easier to understand with a picture.
Below are the locations for Deer 11767. The approximate center of the home range is marked with the red dot. The blue lines are 2 x SD. Each blue line either side of the mean encompasses most of the locations in the east-west direction.
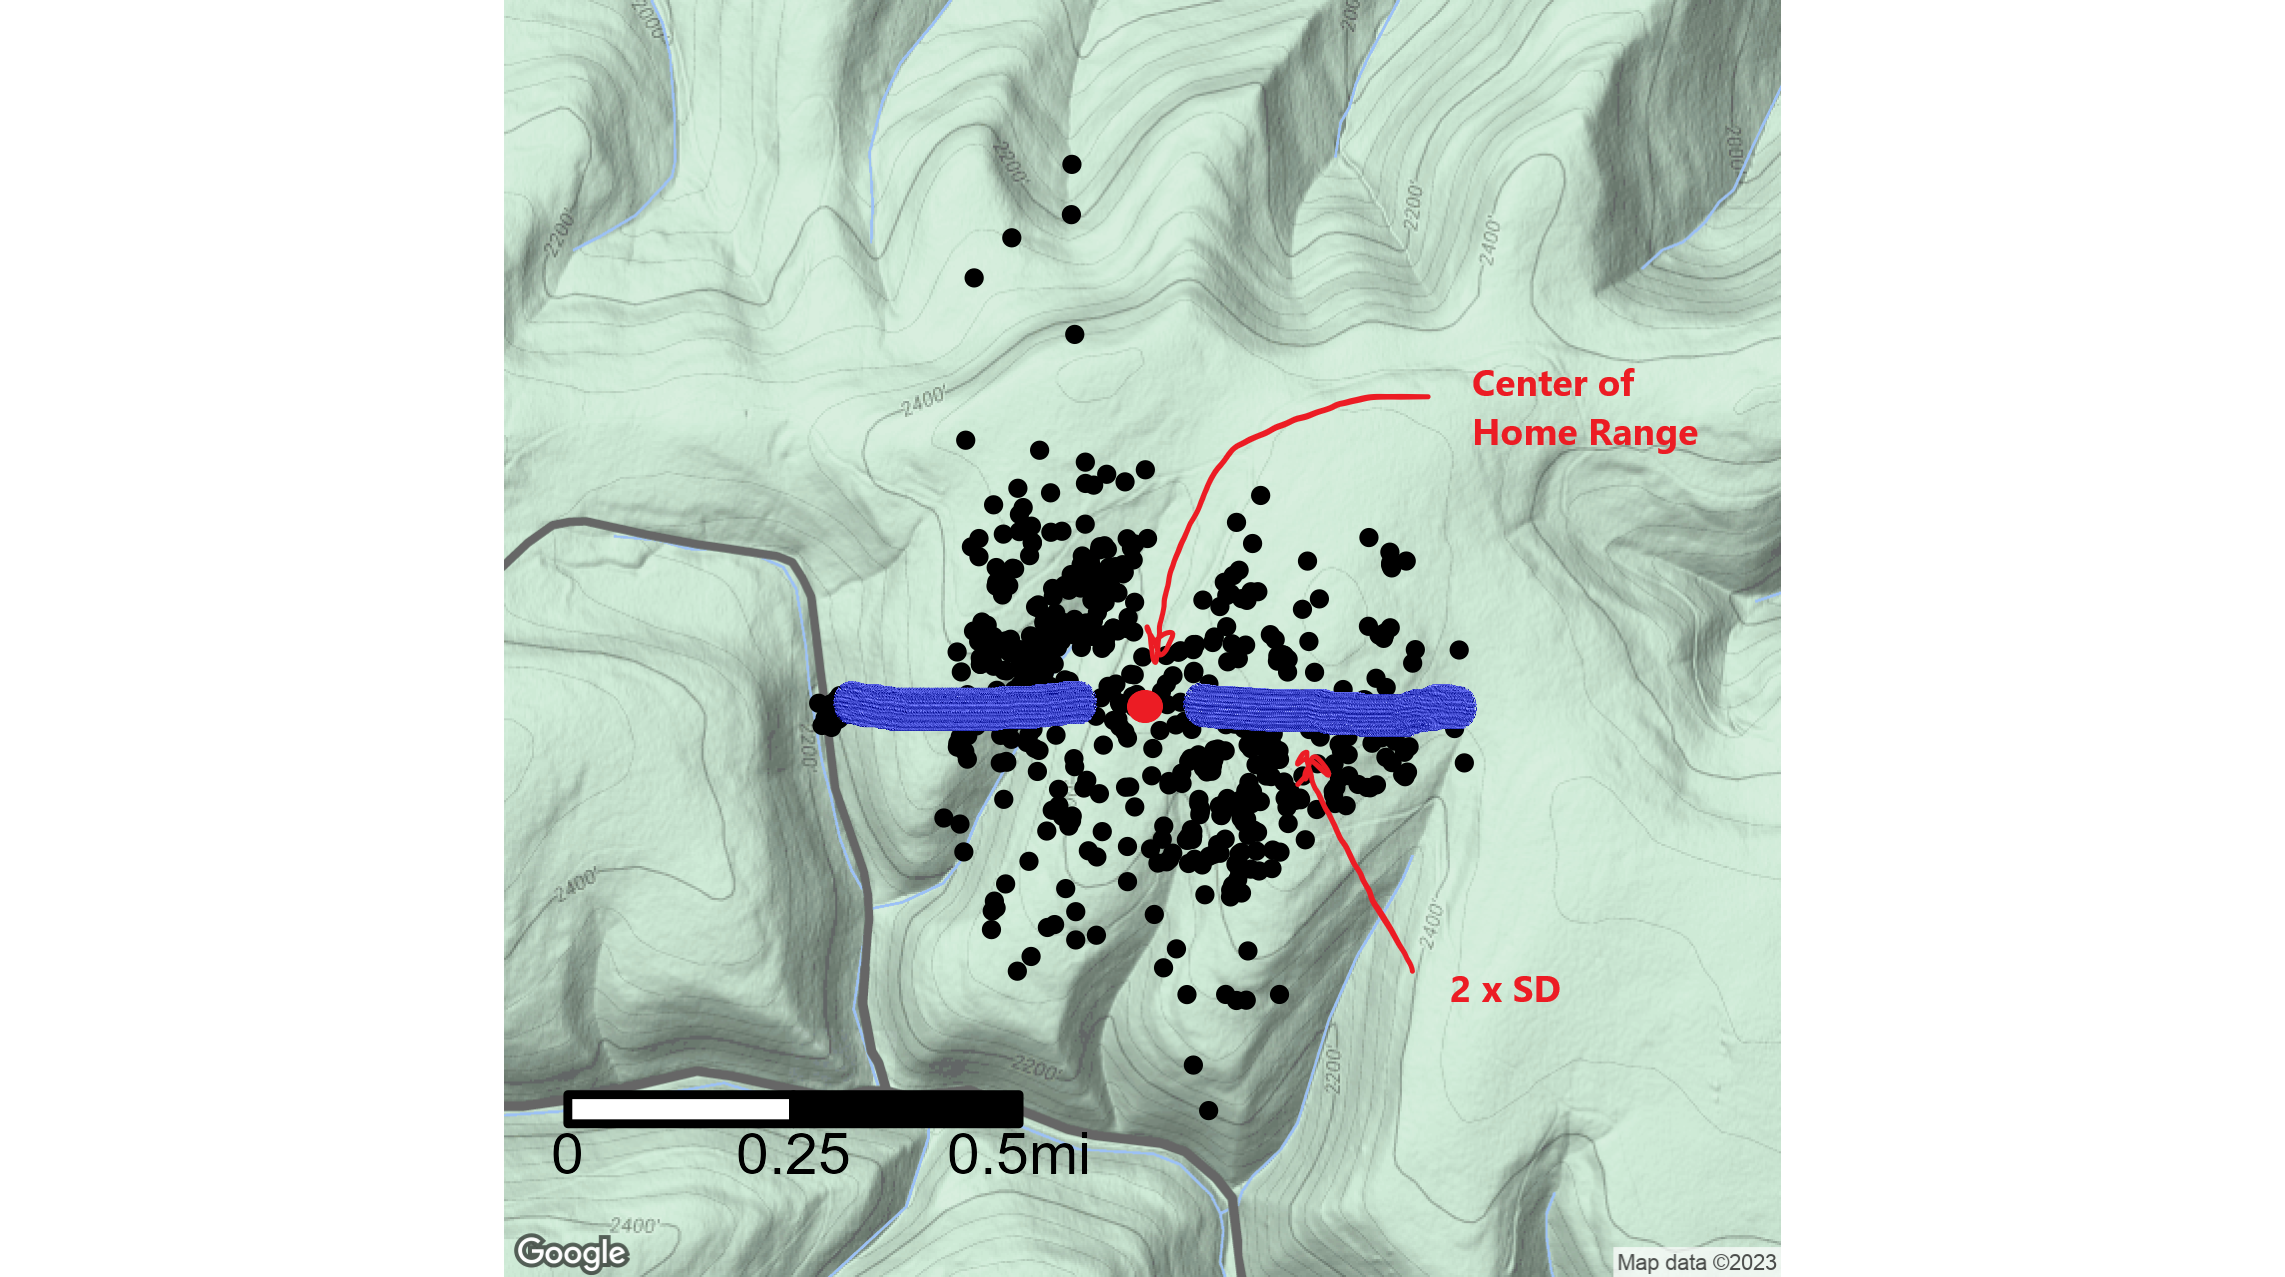
So, we are going to treat 4 times the SD as a measure of a deer’s home range diameter.
So much for the statistics lesson, let’s see what deer are doing. From 2013–2021 we have August and September location data for 301 deer (210 females and 91 males). For every deer we calculated a SD. I’m going to show the results just for the east-west direction, but the results are basically the same if we used the north-south direction.
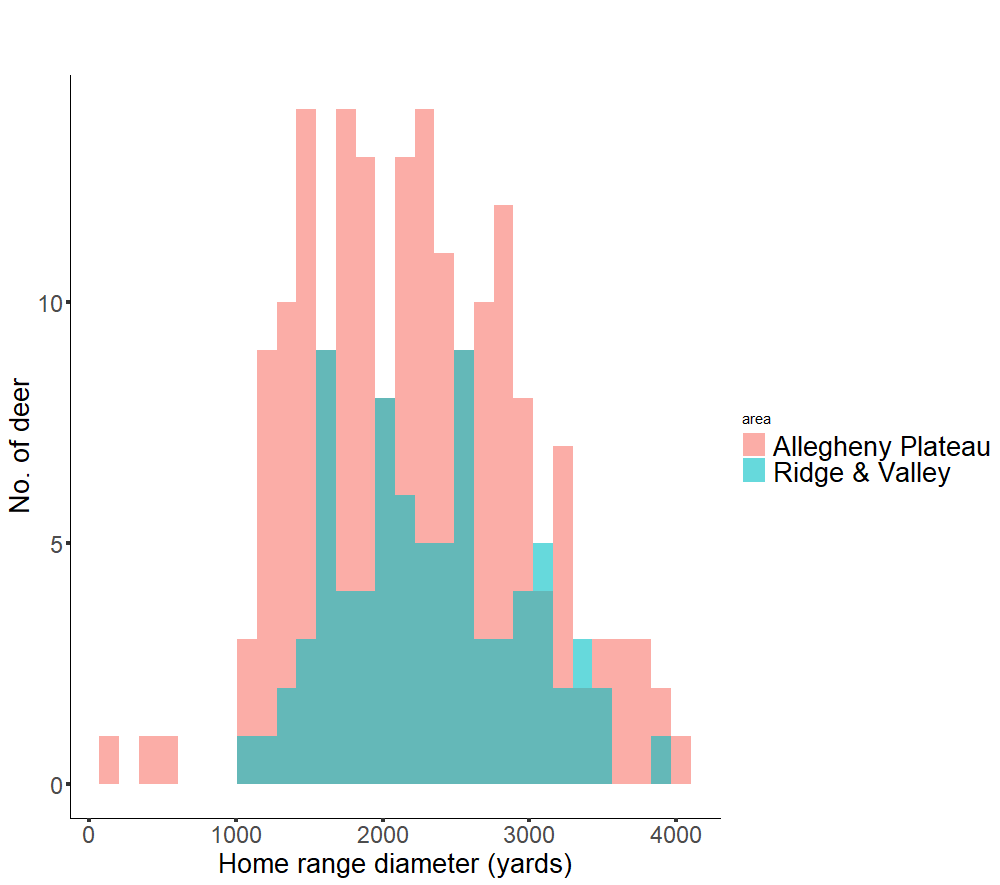
The graph below is the number of deer on the Y-axis and the home range diameter on the X-axis. We have more female data so the vertical bars are taller, but the pattern is similar for males and females.
The average home range is 2,200 yards in diameter. If it were a circle, the size would be 1.2 square miles – just under 800 acres.
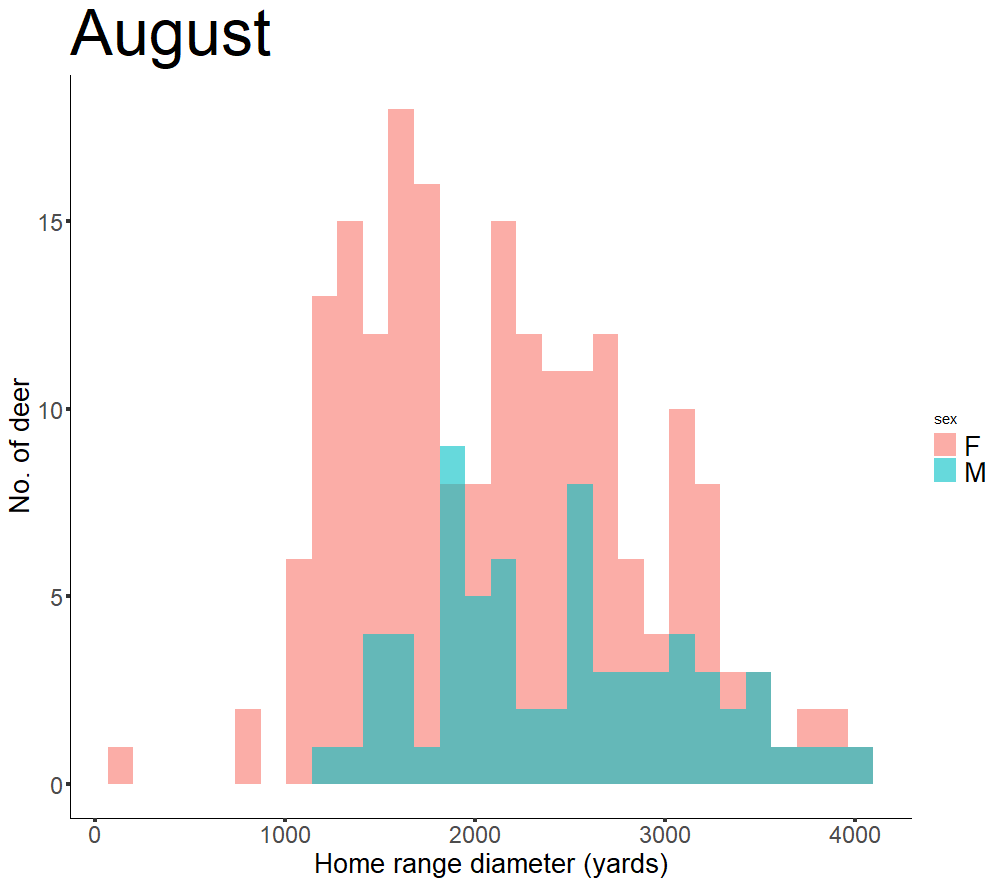
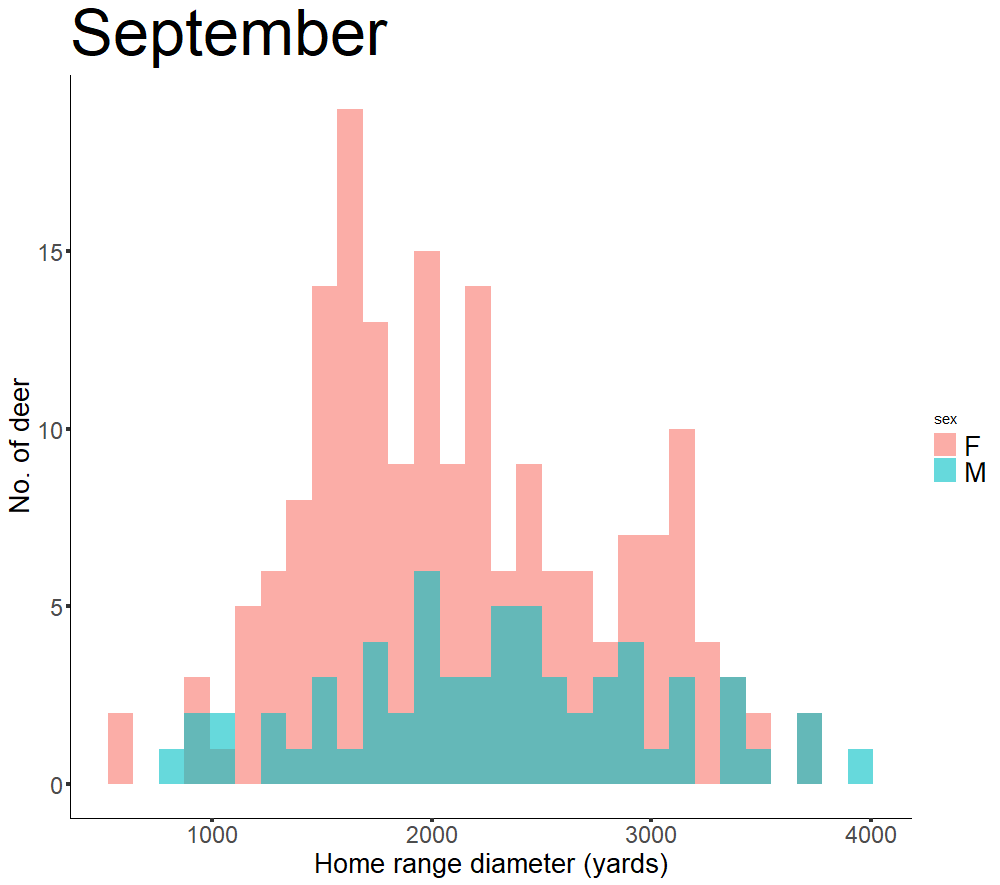
Males have slightly larger home ranges than females, as expected, but there isn’t much difference. Nor is there for September.
We know that landscape can affect the size of a deer’s home range. Our northern study areas are on the Allegheny Plateau in the Big Woods region of Pennsylvania, whereas our southern study areas are in the Ridge & Valley Region. Is there a difference there?
Nope. And I guess that is to be expected since all of our study areas are large tracts of forest.
What about geography? Do the long parallel ridges in the southern study areas influence home range shape or size?
Nope again. On both study areas there is slightly more variation in the north-south direction, but the SD only ranges from 2,211 to 2,443 across both directions and study areas.
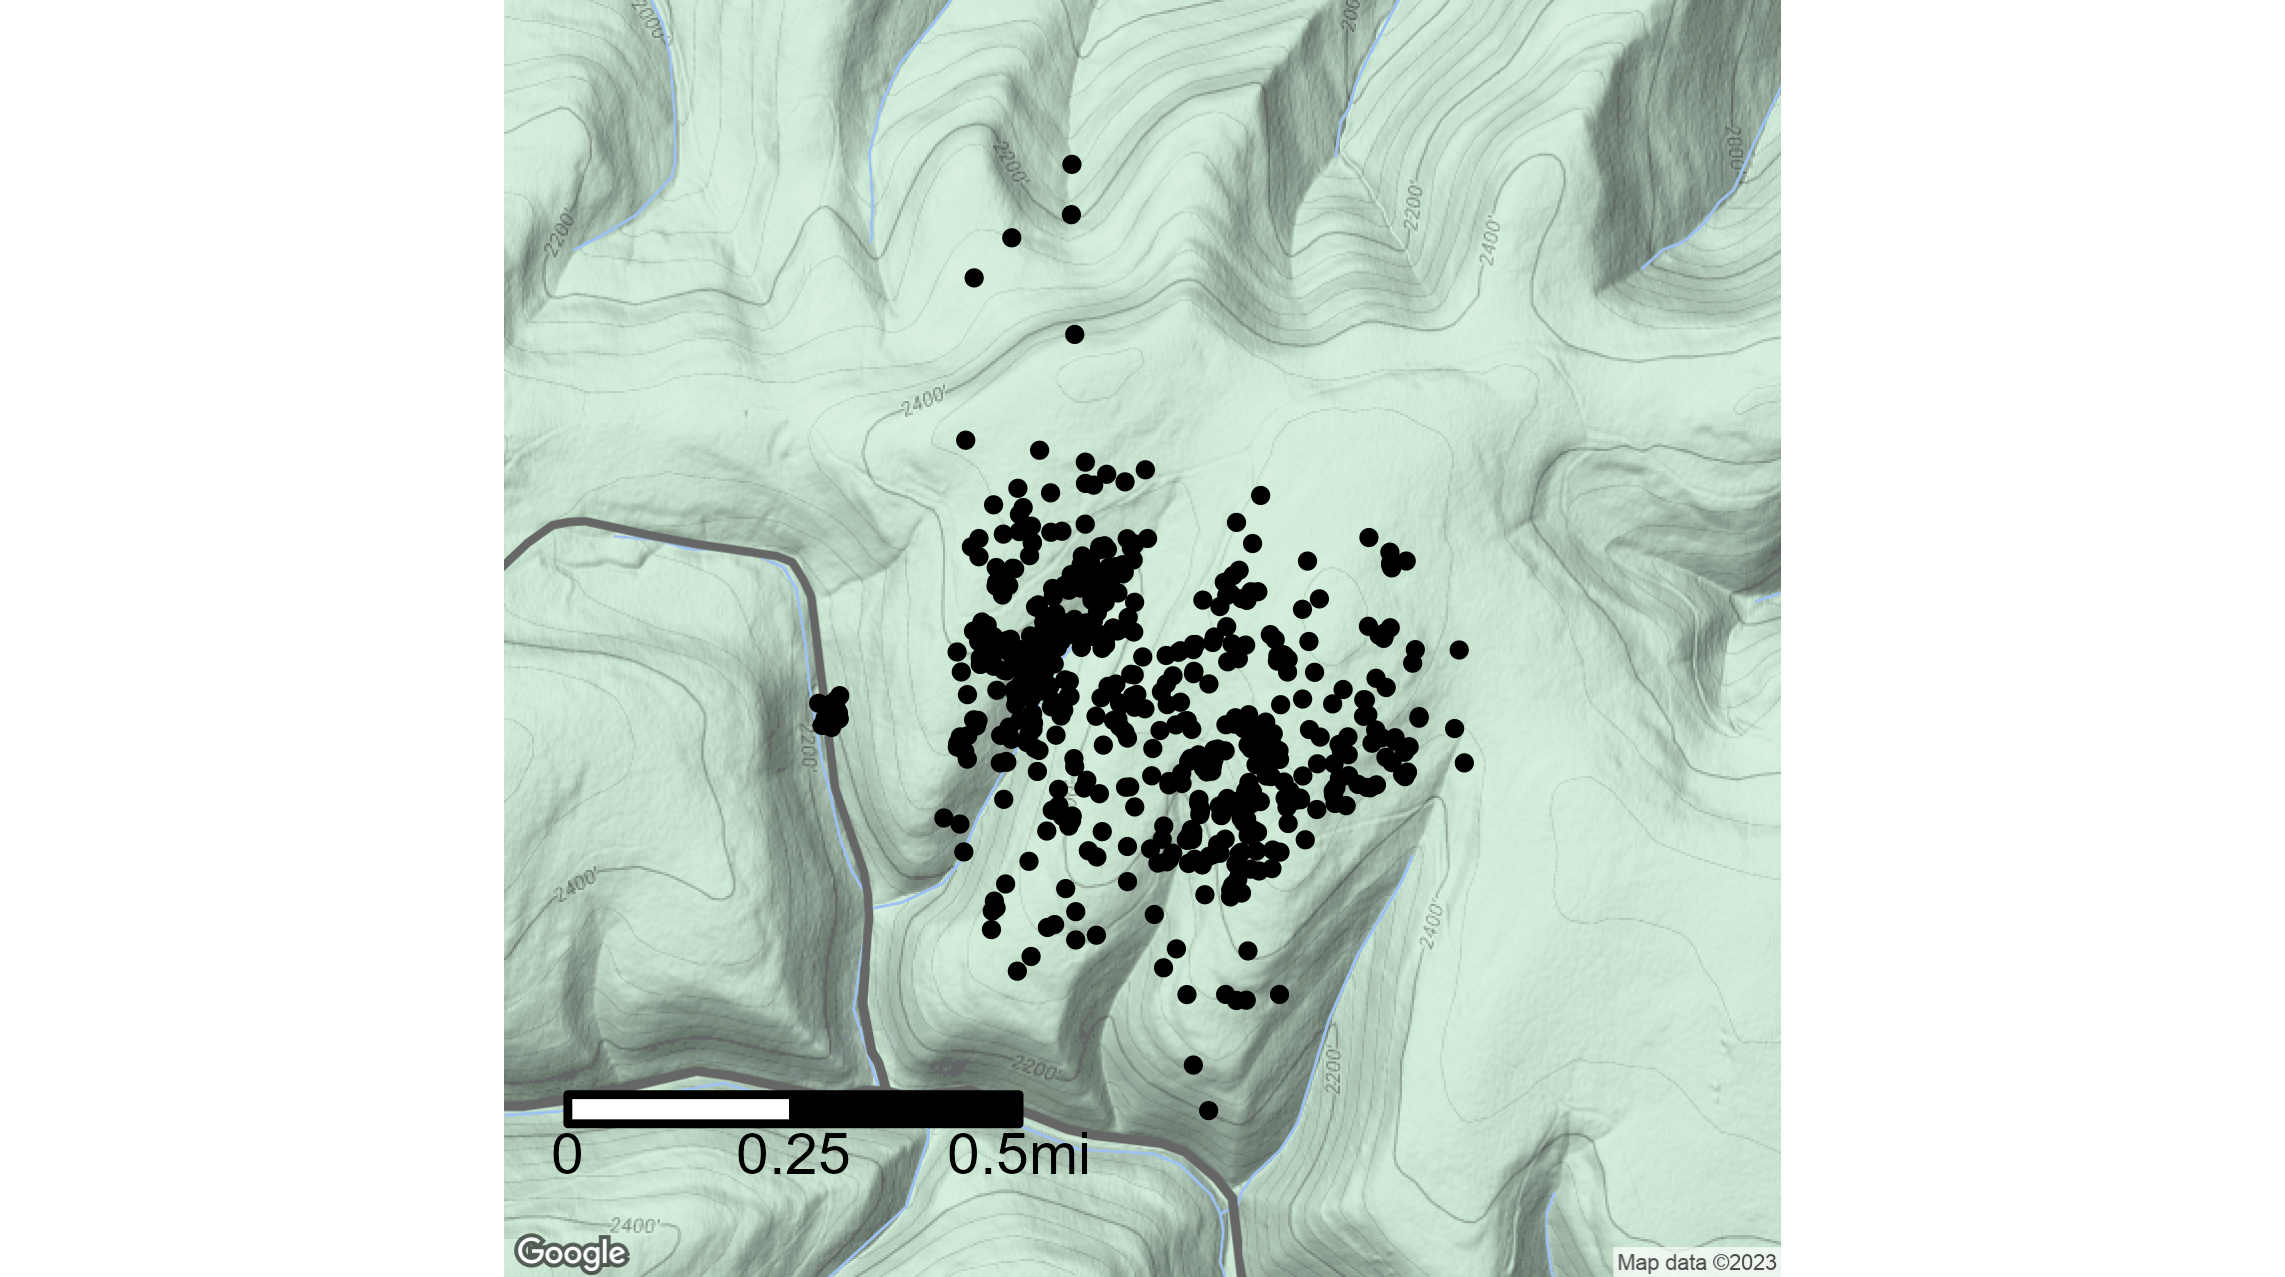
Keep in mind these are only averages. The shapes and sizes of deer home ranges are many, from essentially tomato-shaped on top of a plateau…
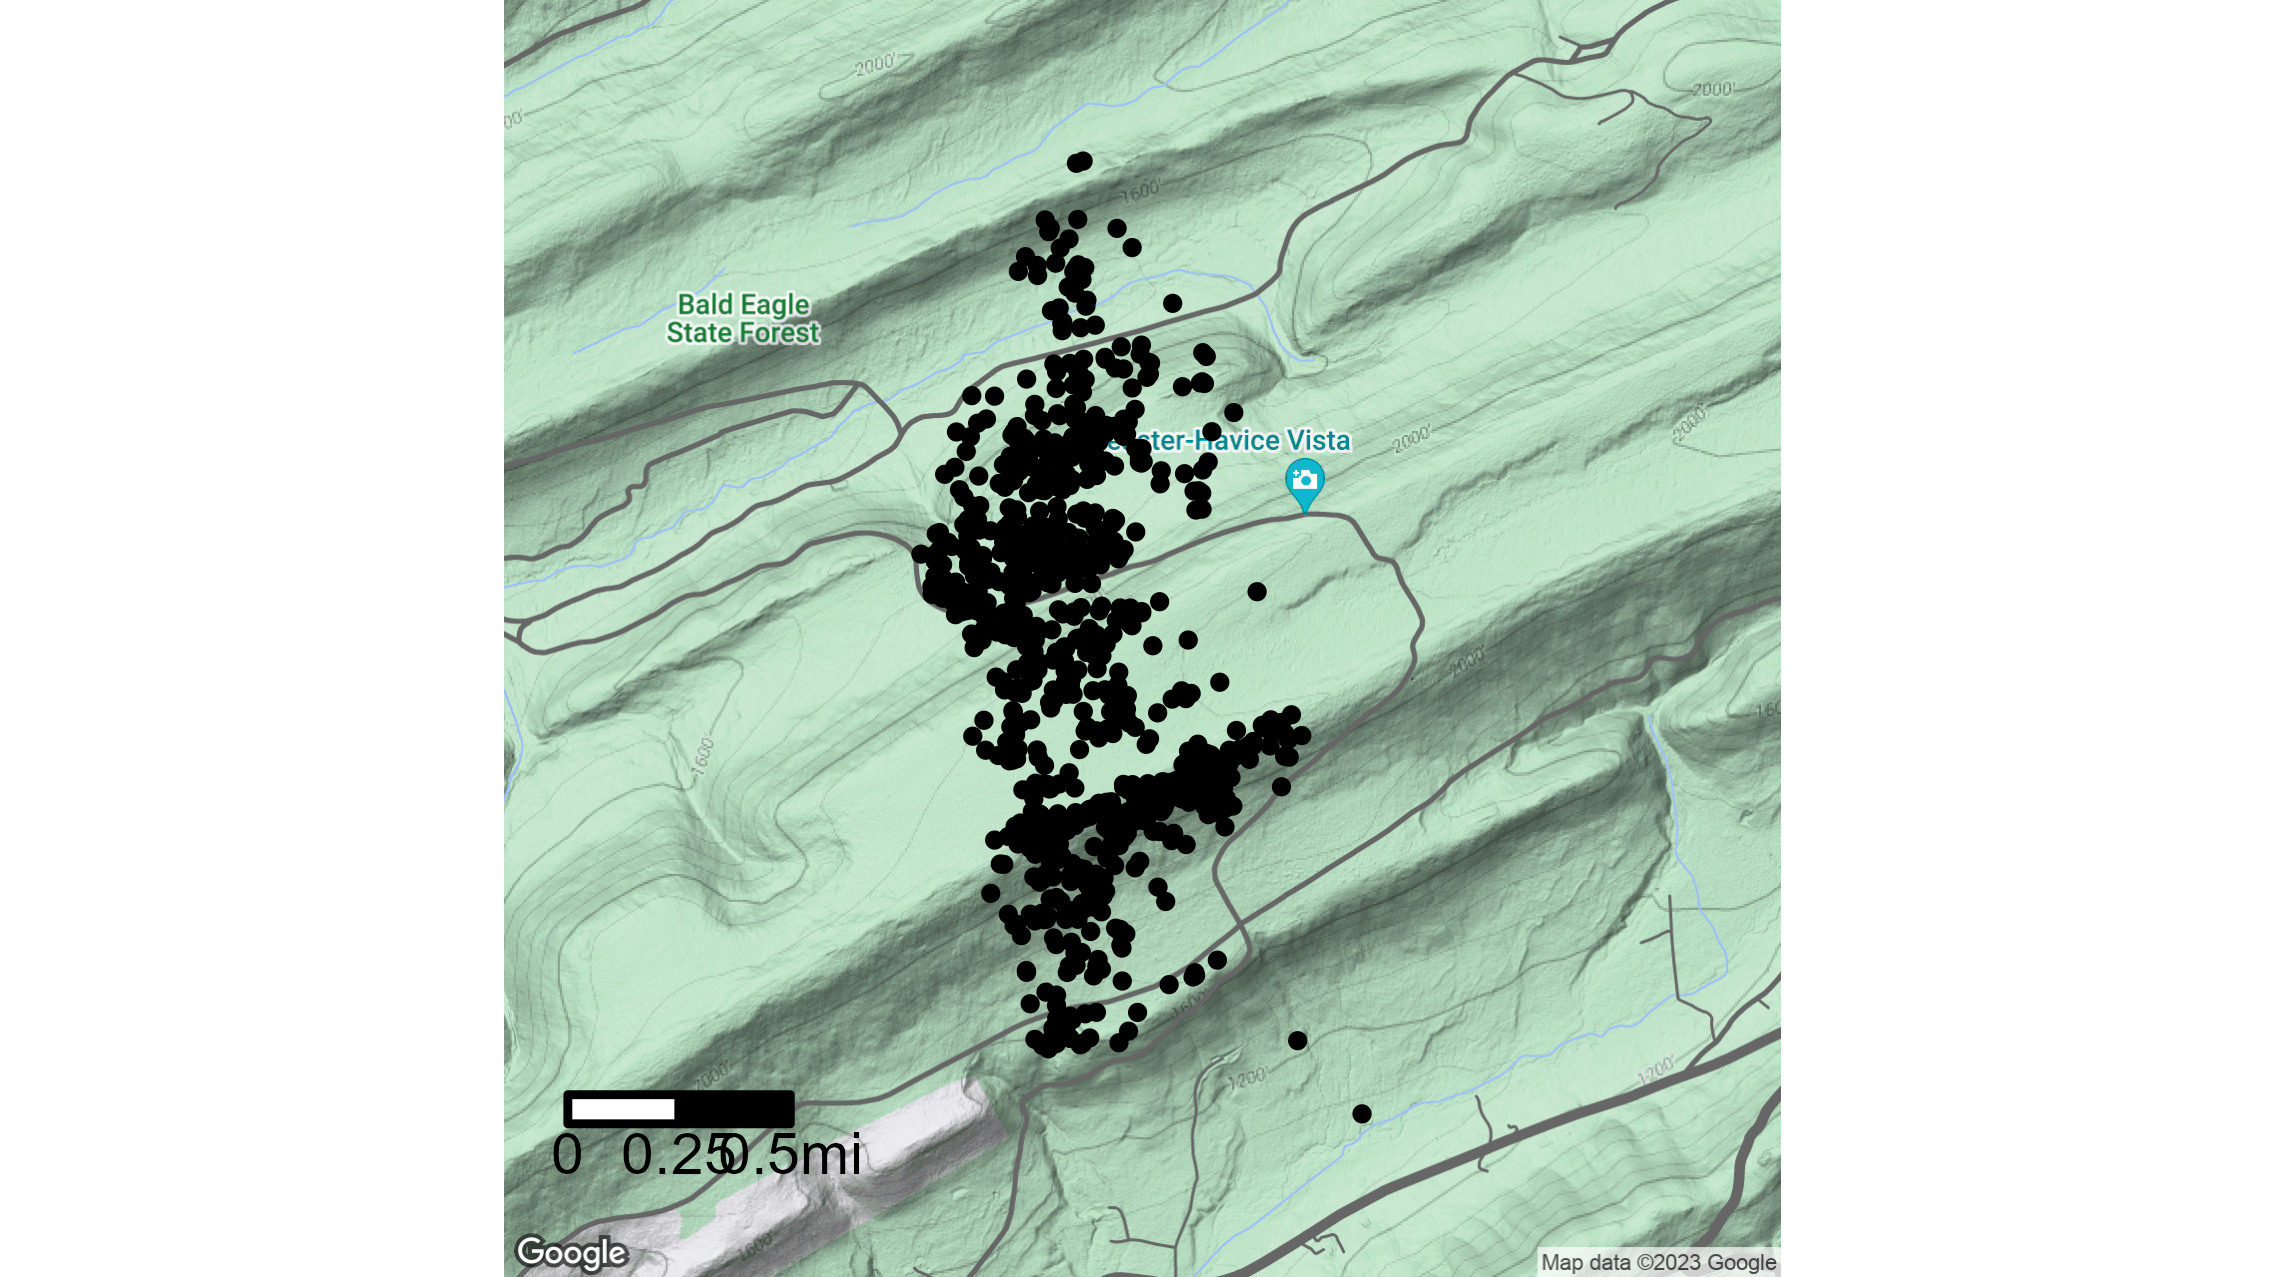
To large zucchini silhouettes where the deer continually crosses the ridges and valleys.
Gardens and antlers may grow and expand over the summer, but home ranges do not.
-Duane Diefenbach