We recently provided an update of bucks leading up to the peak of the rut. If you don’t want to go back and read the post, the graph below might jog your memory. It looked like an exponential increase in movements by late October. How high would it go?
Now let’s see what they’ve been up to in the past couple of weeks.
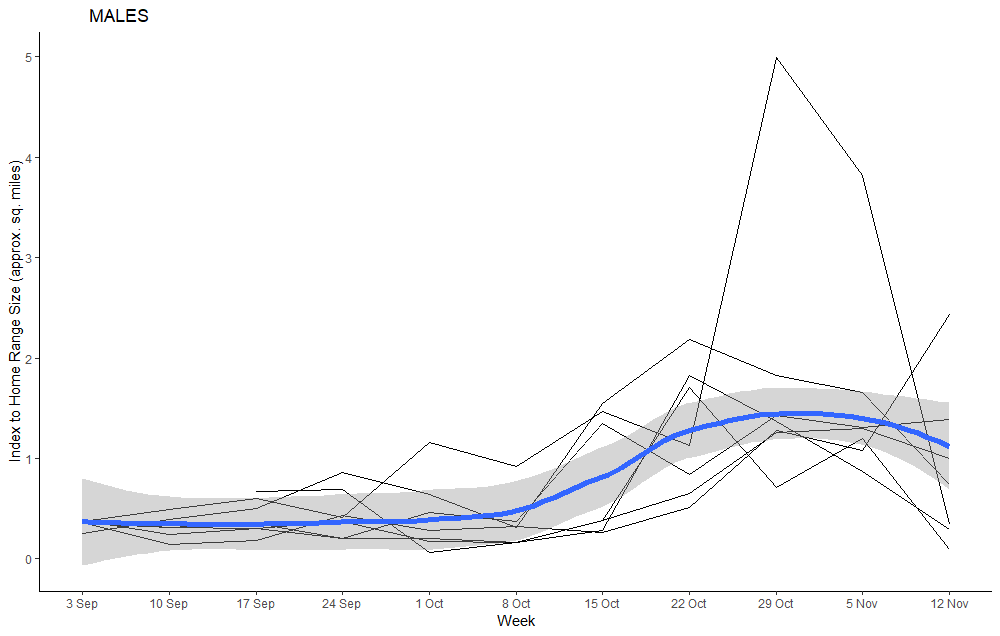
Actually, the graph is rather deceiving because of one male whose home range became extremely large. If we remove him from the graph, we get a better idea of the relative change in home range over the past couple of weeks.
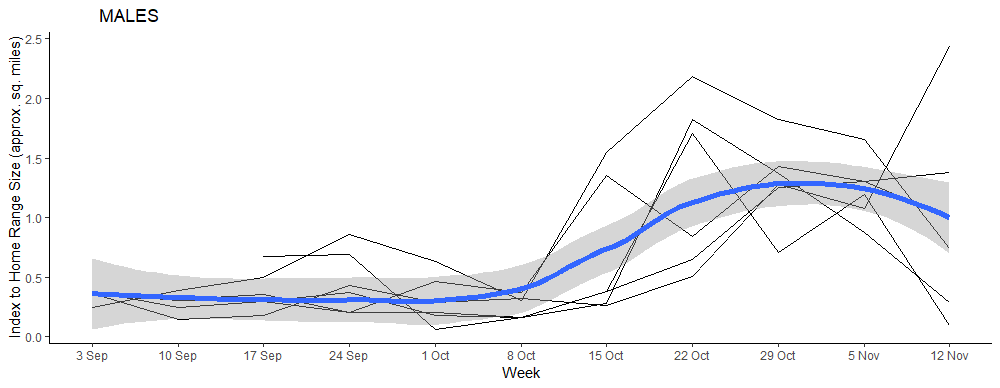
There are a couple of take-aways from this graph. First, home range size basically tripled compared to September and early October. We have found that some of our bucks travel over 100 miles during the month-long rut period.
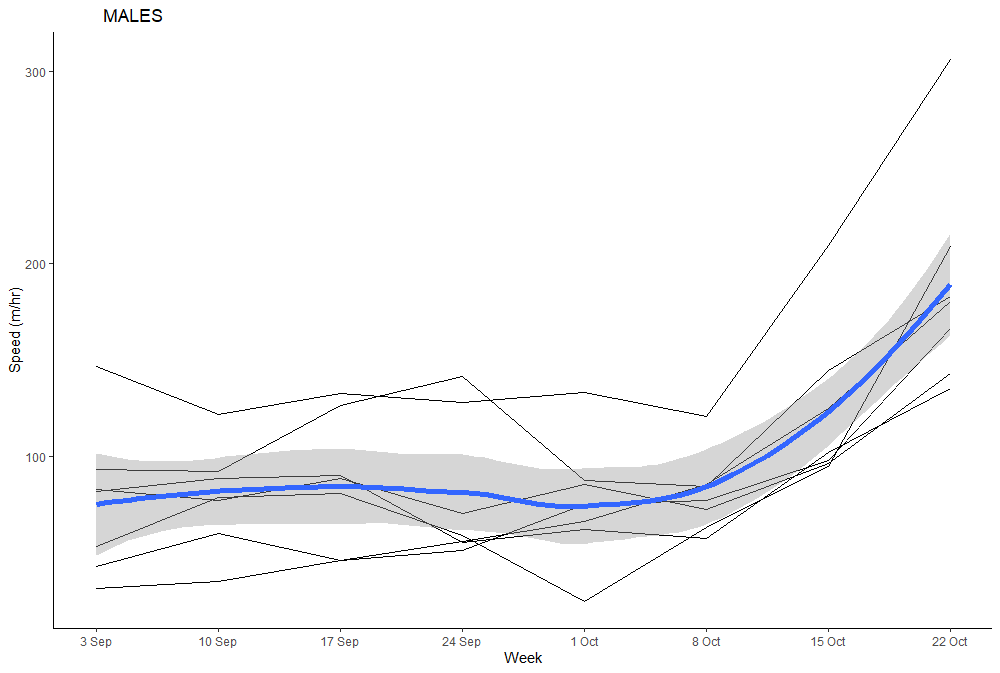
Second, it looks like, on average, we have passed the peak. So do bucks crash and burn? I have no idea, but these data suggest that some buck movements peak early. We can also see this in a graph of weekly average speeds.
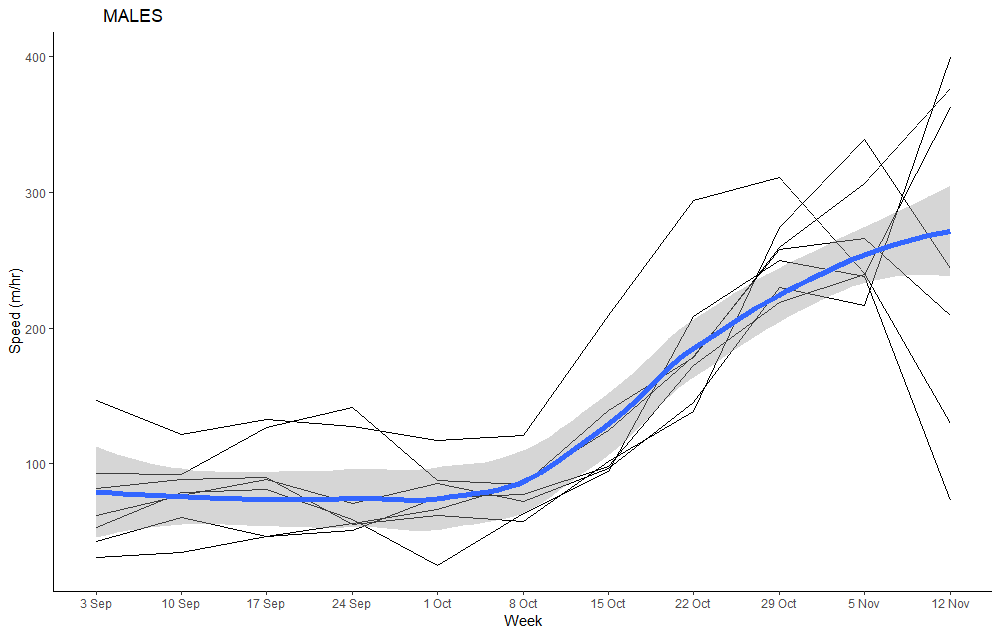
An important point to remember is that averages are not always helpful. The variation that hunters report with respect to the rut may be because of local conditions. Are does concentrated in areas where more mast is available? If so, that’s where the bucks will be. How many does are in estrus in the area you hunt, that will affect buck behavior.
Keep in mind all our deer are adult bucks – most were captured in 2023 so they were at least 2.5 years old, but one was captured in 2022 and another in 2021.
And maybe there is a tortoise and hare thing going on. In the graph above, the buck with the highest movement rates for September and October now has the lowest. Did he go down in flames? Or did he just finally find the does he had been looking for?
-Duane Diefenbach