In the wildlife world, new technology might as well be synonymous with new toy. And who doesn’t love a new toy! This year we are monitoring deer populations on our study areas with new toys…I mean technology.
Estimating deer numbers is difficult and only causes problems for deer managers. Estimates are just that – estimates. It is not an exact number. I can estimate the amount of change in my pocket as 50 cents but it’s not the same as digging out the quarter, 2 dimes, and 8 pennies and declaring I have 53 cents. No one is happy with an estimate when it comes to deer. And everyone proclaims the estimates are wrong.
This is why the PGC focuses on trends rather than deer numbers. When making management decisions, it’s the trend that is important. The way to solve any deer conflict is to change the trend – whether that be up or down. No conflict was ever solved by adding or subtracting X number of deer from the population.
However, research is a different story. We want to have as accurate an estimate as possible. Knowing the deer density and whether it has changed and by how much tells us how well our treatment worked.
But remember, estimating deer numbers is hard. I know this for a fact. I have been doing it for much of my career! The problem is deer don’t like to be seen so you never see all of them. Welcome to the world of detection probability. Estimating a detection probability is either difficult or expensive to do but most often it is both difficult AND expensive.
Here is where the new toy comes into play. We are using FLIR technology and data from our GPS-collared deer to estimate deer density.
The Toy
FLIR stands for Forward Looking InfraRed. Ten years ago, FLIR cameras would have cost tens of thousands of dollars and weighed many pounds. Today they will fit in the palm of your hand and cost just a few thousand dollars. And they are way more sensitive. The miracles of science!
Check out this porcupine! You can even see his “heat” prints on the ground! How cool (or maybe hot) is that?
These cameras can also display the infrared radiation in different ways. Fusion isn’t just the latest cuisine style. It’s the FLIR camera setting used to see our prickly friend. Fusion seems to work really well for seeing all sorts of critters (rabbits, mice, deer, etc.). There is also “black hot” or “white hot.” The image below of a deer running away is in “black hot” mode where warmer objects are blacker.
Playing with the Toy
We use the FLIR cameras to conduct surveys. We have identified about 15 survey routes in each of our study areas. Surveys are conducted from ½-hour before to 2 hours after sunset.
A survey crew consists of a driver and two observers. The driver watches for traffic and deer in the road. The driver also chauffeurs the observers in the back seat.
Each observer has a FLIR camera hooked up to a laptop computer with an integrated GPS unit (more toys!). When a deer is detected the crew stops, records the location of the vehicle, then uses a laser rangefinder to get the direction and distance to the deer. The computer uses this information to calculate the location of the deer.
The Position of the Players
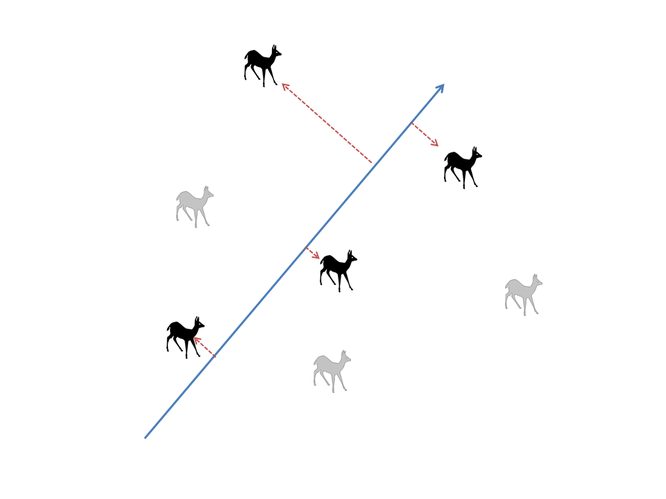
Once we’ve played with our toys, we go back in the lab where we can take the location of the road (blue line below) and the location of the deer detected (deer in black) to determine the perpendicular distance of deer from the road. In our game, there are 2 types of deer – “black” deer and “gray” deer. Or deer that we see (black) and deer that we might have missed (gray).
How do we know we may have missed some? Well if we plot a histogram of the number of deer detected by distance from the road, it might look something like this.
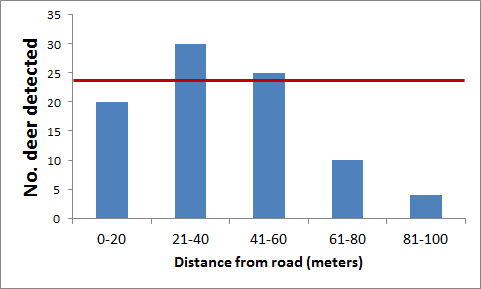
We see a smaller proportion of deer as distance from the road increases. If detection was 100%, regardless of distance, then our blue bars should all cluster around the red line.
By assuming we see all the deer on and near the road, we can estimate the proportion of deer we detect out to 100 meters. If you are having a bout of insomnia, here’s a link for more information about distance sampling.
A Nerd’s Favorite Game
An important assumption of distance sampling is that transects are randomly located on the landscape. So if we could see ALL the deer, we would be just as likely to see them close to the transect line as far away. But we all know roads are not randomly located transect lines!
Did you notice how the count of deer is lower at 0-20 meters than it is at 21-40 meters? How can that be? Is our driver blindfolded? That would definitely add an element of excitement to this game. However, it would not serve our safety-first motto. The reason the deer count is lower at 0-20 meters is because deer are less likely to be near the road – that breaks a very important rule of our distance sampling game.
What’s a nerd to do?
Here’s where that “close” relationship with our study animals comes into play. Trapping crews have poured blood, sweat, and tears into collaring deer the last several months (and years). We can alter the location fixes of those collars to collect a GPS location every 15 minutes during our survey period (1/2-hr before sunset to 2 hours after). By plotting those locations as a function of distance from our transects, we can correct for the fact that there are fewer deer near roads.
It’s complicated, involves calculus, and I love it!
This is the first round of this game. The toys are fun and the game is challenging. When all is said and done, the nerds hope to “win” by get some estimates of deer density on our study areas. When we do, you’ll be the first to know!
Until then check out some of the footage from our FLIR cameras. It’s like a spotlight on steroids, which in this game is completely legal.
-Duane Diefenbach
If you would like to receive email alerts of new blog posts, subscribe here.
And Follow us on Twitter @WTDresearch