
If you’re a long-time reader of the blog, you’ll remember Down in the Dirt! and The Results are in!, which covered how occupancy of some plant species was related to soil chemistry and other environmental conditions like total plant cover. We only covered shrubs and forest herbs in those posts, which left a lot of readers asking the obvious question, “What about the seedlings?!”
I finally have (some of) the answers. The figures below show how occupancy of the four most common seedlings across the study area changes in response to different environmental conditions. Remember, occupancy probability is the probability that a site is occupied (1 is it is occupied 100% of the time, 0 is none of the time), and the x axis is how that probability changes across some environmental characteristic (like pH or cover).
Each figure represents a “best” model that explains observed occupancy trends across our study area.
Let’s start with red oak, which is the second most-common oak we encounter on a day-to-day basis. Was occupancy related to any soil chemistry variables like pH or aluminum saturation?
Here’s the result:
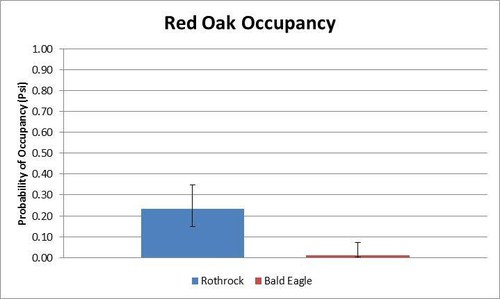
And the answer is nope.
There are differences in red oak occupancy across state forest, but nothing else. This is really surprising, because Rothrock and Bald Eagle were chosen as study locations because of their similarities. These differences, while entirely unexpected, likely reflect differences in management activities. (Each state forest is managed differently and has different management objectives.)
What about red maple? Without a doubt, red maple is the most common seedling we come across at our study sites. How did it fare when it comes to soil chemistry? Again, we saw a difference across state forest, with higher occupancy in Rothrock compared to Bald Eagle, but interestingly we also see an increase in occupancy across effective cation exchange capacity of the soil:
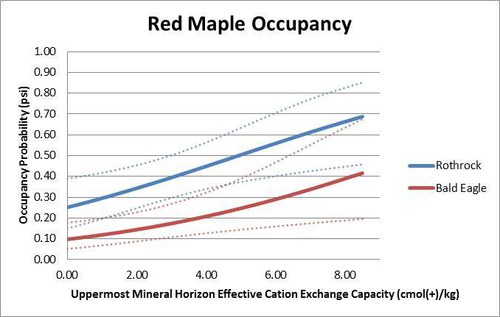
Effective cation exchange capacity measures the the capacity of the soil to exchange nutrients with soil water, and isn’t an actual measurement of site quality. It includes all cations that are exchangable to plants (the good like calcium and magnesium, but also the bad like aluminum). For red maple, this relationship with ECEC is driven by both calcium and aluminum. It does really well on calcium rich sites, but also does well on sites that have high levels of aluminum. It’s a generalist! This might explain why red maple is so common across the study area.
Surprisingly, black birch occupancy was consistent across the entire study area, and did not vary across any environmental characteristic, including state forest, soil chemistry, or openness (I didn’t graph it because there’s nothing to graph!). Something probably explains black birch occupancy, but I didn’t measure what that something was.
What about chestnut oak? Well, it’s complicated. It also is more likely to occupy Rothrock compared to Bald Eagle. But, occupancy was also influenced by openness and calcium concentration. The graph looks busy because the relationships are interacting (where you are + calcium + openness = occupancy probability). Each line plots the occupancy relationship across a different level of plot openness, and dashed lines are 95% confidence intervals.
To avoid plotting the same graph twice, I’ve only included the Rothrock plot (Bald Eagle looks identical, but occupancy probability is lower across the board). However, occupancy trends are probably different than what you might expect:
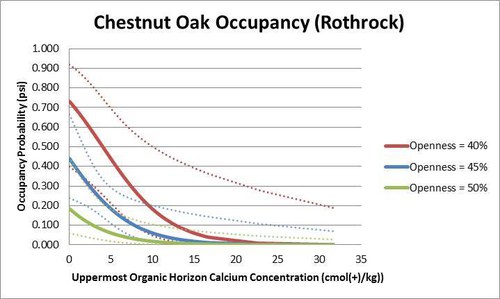
That’s right, occupancy probability of chestnut oak decreases with increasing calcium concentration and also decreases as plots become more open. This is the complete opposite of what I (and probably you) expected, but data don’t lie.
Oaks grow exceptionally well on dry, nutrient-poor, sandstone-derived soils. Ecologically they are adapted for this type of environment, which explains why we find them on ridge tops in the ridge and valley province of Pennsylvania. Valley bottoms in this area, compared to ridges, are usually limestone derived and have much higher levels of calcium and magnesium available. That’s why a lot have been converted to agriculture!
Chestnut oak appears to be exceptionally resilient to low calcium environments with most occupying sites with little to no calcium available within the first soil horizon. It’s doing what it does best, which is really good news for foresters. It doesn’t appear to be sensitive to toxic metals like some other species we’ve discussed in the past.
What about openness? Everything you’ve ever been told about regenerating oak says you need light, and lots of it. There’s a reason shelterwood harvests are commonplace throughout our study area. The “canopy” photos I used for analyzing openness are a bit misleading. I measured openness at 3ft off of the ground, and not above all of the shrubby vegetation (the actual forest canopy). I’m only so tall, and sometimes those shrubs can be in excess of 15 feet tall. Without special equipment I was unable to get measurements of the true canopy where the shrub layer was dense.
The fact that chestnut oak occupancy is actually higher where openness is lower could be related to moderate shade tolerance. Oaks will persist in the understory for several years after germination waiting for a canopy gap. Cover may also protect them from deer browsing or indicate more favorable canopy conditions. Lots of competition (cover) could mean lots of light is actually reaching seedlings, but if they are > 3ft tall they are contributing to a lack of “openness”. It’s hard to say the cause, but there are several reasons why our openness value may actually create results that are a bit counter-intuitive. Finding a better way to quantify light levels is something we should explore in the future.
Overall, it’s good news on the seedling front for oaks. Neither red oak nor chestnut oak appear to be sensitive to toxic metals or low nutrient levels, and in fact, chestnut oak actually seems to prefer sites that have very low calcium. However, red maple is becoming more common across its range, particularly in eastern forests. Its ability to grow across a wide range of soil chemistry values may explain why this is happening in Pennsylvania.
Of course, I have more data to explore and occupancy models are just one piece of the complicated forest puzzle. Next I will be looking at abundance and how that relates to some of the experimental treatments I applied over the last several years.
span.s3 {text-decoration: underline ; font-kerning: none}
Stay tuned!
Ph.D. Graduate Student
If you would like to receive email alerts of new blog posts, subscribe here.
And Follow us on Twitter @WTDresearch