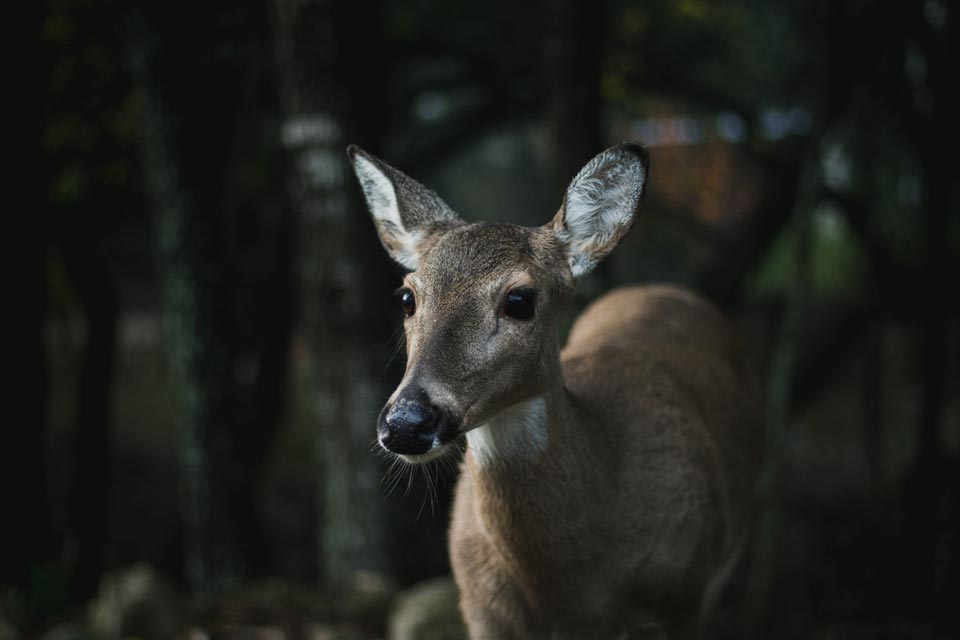
Age old questions of “what kills the most fawns?” and “how many fawns survive?” have inspired the completion of over 30 studies of fawn survival since the early 1970’s. Over time, the questions have become more complex. Does deer population density affect the number of fawns that survive? Does landscape type such as forest or agriculture influence predation rates, fawn starvation, or even the rate of human-caused mortality?
Despite the seemingly large number of studies concerning fawn survival, these more difficult questions can’t be answered with a single study. Most studies can only focus on one area and a single population of deer. A study that looks at fawn survival in a high density population may conclude that deer density influences fawn survival in their study area. But what if it was a different factor all together?
There is strength in numbers. With so many studies conducted, looking at their results together could illuminate larger patterns in fawn survival across different landscapes.
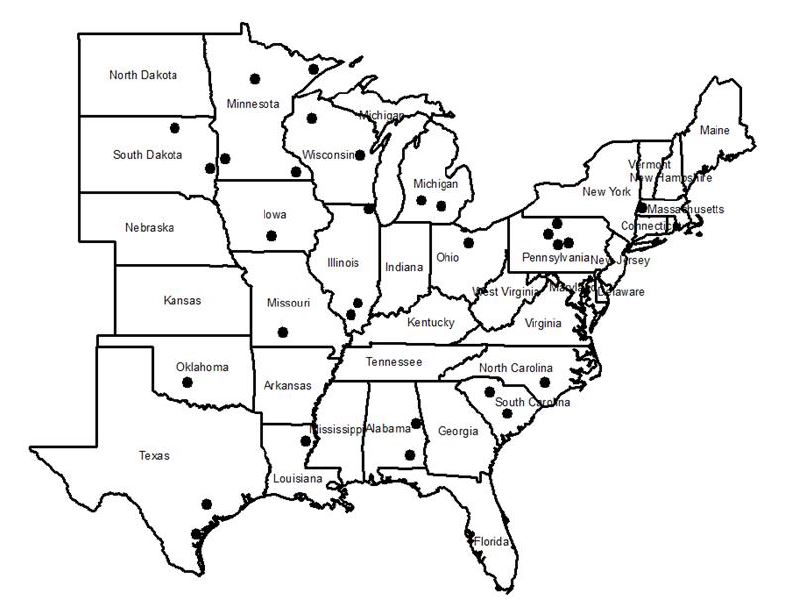
We used data from 29 deer populations to see if we could find that light switch. Below are the locations of the studies.
With 29 different locations and deer populations, let’s start with deer population density. Does it affect fawn survival?
Some studies suggest high deer densities may result in lower fawn survival. The two main reasons – space and food.
First, high densities of deer mean there are more deer on a landscape eating. This may limit the available food for fawns and their moms. Less food might mean more starvation and vulnerability to predation. Second, one study suggested moms in high density populations could not access enough space to be alone with her fawn during birth to ensure social bonding. Bonding is critical and without it there are higher abandonment rates and fawn mortality.
With a wide range of population densities on these 29 studies, we looked to see if there was a relationship between fawn survival and deer density.
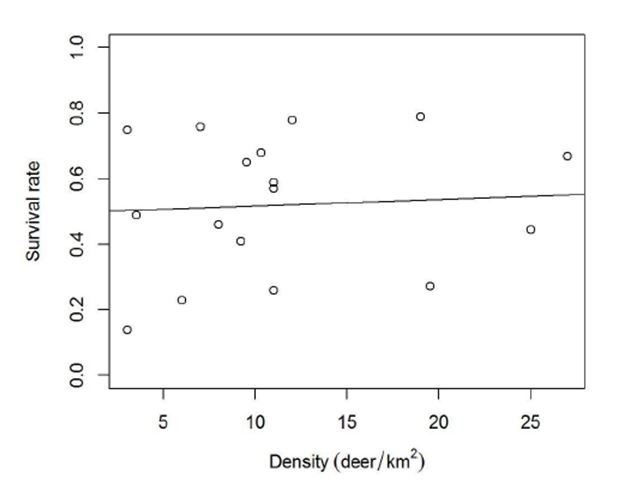
Despite the prediction, no relationship between the density of a deer population and the rate of fawn survival was detected! On the graph below, you can see fawn survival rate on the Y-axis (a survival rate of 1.0 means all the fawns lived) and deer density (deer per km2 ) on the X-axis. Fitting a line through these data points reveals a very flat line which means there is no positive or negative relationship between fawn survival and deer density.
When considered alone, estimates of deer density do not measure the actual factors that influence survival (such as food and space) and if they are limited within a given landscape.
For example, let’s say two landscapes have the exact same deer density- but Landscape A has more and higher quality food than Landscape B. As a result, Landscape A may have a higher fawn survival than Landscape B even though they both have the same deer densities. As such, our ability to detect a relationship between deer density and fawn survival is limited.
So what about those other environmental features like landscape type (forest or agriculture) predators, and people?
No worries. We looked at those too and will share in upcoming posts.
M.S. Graduate Student
Previous article in this series:
Introduction: Fawns, Predators, and Deer Populations
Next article in this series:
If you would like to receive email alerts of new blog posts, subscribe here.
And Follow us on Twitter @WTDresearch