Deer management, in the condensed version, has 3 steps:
- Identify goals and objectives
- Collect data to assess deer population and habitat with respect to Step 1
- Make a management recommendation to decision makers.
Repeat Steps 2 and 3 annually.
Simple, right? There is one small problem: Step 2. In particular, the word “assess.”
And while these 3 steps have remained consistent over the last 5 decades, how we “assess” deer populations using those collected data has changed.
The first peer-reviewed deer population model was published in 1976 by Game Commission Biologist Lincoln Lang (Lang and Wood 1976). William Shope, also a Game Commission biologist, developed a more sophisticated model in 1978 (Shope 1978). It worked well until antler point restrictions were implemented. So Coop Unit graduate student, Andrew Norton, developed the current model used by the agency today (Norton et al. 2011).
But let’s go back to the 1970s. Bill Shope recently shared with me a history of data processing at the Game Commission when he started (1970) until his retirement (1999). In the beginning, the tools available to him for analyzing all the data collected on deer were, in his words, “…12 legal tablets, a box of pencils, a Monroe adding machine, and an old manual typewriter. My only computer was a slide-rule that I used at PSU.”
Bill further explains, “The primary data processing [device] for the Commission was IBM Tabulation equipment from the mid 1940’s. From the pictures I was able to find online, I believe it was an IBM 602A from 1946. This equipment used electronic boards with wire jumpers to do tabulations. Hank McCauley was the programmer and he prepared the electrical circuits for each job. The equipment was primarily used to do accounting work for payrolls and summary reports required by the Commission for all its operations. It was also used to tabulate deer report cards and to summarize data from harvested deer examination forms.
“Early on it became apparent that this equipment would be of limited use for statistical work. For example, I wanted to do standard errors for game-take survey estimates. I approached Hank about the programming that would be involved. I found out that he had no idea how to calculate the square root of a number. So after I explained how to calculate a square root, he spent about a week programming the old tab equipment to do square root calculations. The first run to calculate a single square root took 2.5 hours. I concluded from this experience that it would not be very practical to use this equipment for statistical work. Consequently, I did not do much with statistics in my early years with the Commission because I lacked a practical way to do the calculations that were involved.”
Sir Arthur C. Clarke once said “any sufficiently advanced technology is equivalent to magic.” Magic was about to happen to deer management.
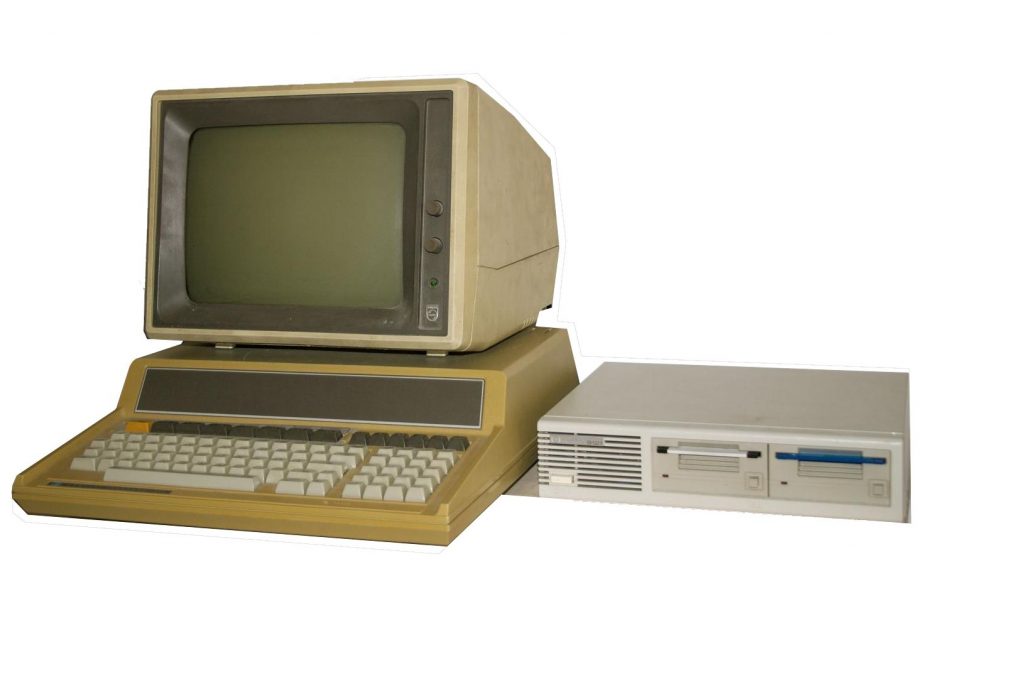
In 1983, the Game Commission purchased its first desktop computer: an HP 86B and an HP drum plotter for $30,000. The HP 86B was a 64K machine that could be expanded with 128K memory cards that could be added to three card slots in the back of the machine. The operating system was MS-DOS. The software available for this computer consisted of mapping software, a VisiCalc spreadsheet, a word processor called Word Star, and a programming language called HP Basic. For comparison, the laptop on which I am typing this is a 32 Gigabyte (32,000K) machine with 100s of programs that can be run simultaneously (within reason) and costs under $1,000.
Bill notes, “It took me about two weeks to learn HP Basic. After that I began writing a variety of programs for different jobs including a program to calculate deer populations. By early 1984, I had completed and tested the first computerized version of the deer population management program in HP basic.”
A single run of the deer program on the HP 86B took 26.5 hours. Because this was the only computer in the Game Commission, scheduling was a real issue. So in 1987 the Bureau of Wildlife Management purchased an IBM desktop. Bill converted the deer program to TurboBasic and processing time was reduced to less than half an hour. The magic of technology knows no bounds!
Bill wrote, “The deer program I wrote in 1984 was used until 2002 to estimate deer populations and determine antlerless allocations. When the Commission instituted antler restrictions, this created a bias in the age structure of the antlered harvests that violated a key condition [of the model]. As a consequence, the program I wrote is no longer being used to estimate deer populations in Pennsylvania.”
Today, the Game Commission’s deer program relies heavily on computer technology. About 200,000 harvest reports are submitted via the internet, phone, or mail-in report cards. All that information is tallied in a computer system.
Agency staff check over 20,000 harvested deer each year to age and sex the harvest and estimate reporting rates (percentage of harvests reported to the agency). All those data are recorded on handheld computers.
Although the basic approach to deer management hasn’t changed, the technology is far beyond that first HP 86B purchased by the PGC. As Bill said, “Sometimes we need to look behind us to see where we have been to appreciate how far we have come.”
-Duane Diefenbach
I would like to thank Bill Shope for sharing his knowledge about the history of deer population modeling since the 1970s.
Photo credit (featured image): Olivetti P602 calculator, CC BY-SA 4.0, Laboratori Musee Tecnologicament (no modification to image).
Photo credit (inline image): HP 86B, CC BY-SA 3.0, (no modification to image).